
FUNDAMENTAL OVERVIEW
The Nasdaq futures opened lower today following Trump’s escalation over Greenland. In fact, the US President threatened to impose 10% tariffs starting on February 1 on the UK, France, Germany and a few other European countries unless the U.S. is permitted to buy Greenland. The tariffs will rise to 25% from June 1 in case of no deal.
As seen last year, risk-off moves caused by Trump’s tariffs stemmed from growth worries. Growth expectations are the main driver of stock markets and when something leads to negative expectations, we generally get selling pressure until those expectations are corrected.
Everyone is now waiting for the famous TACO ("Trump Always Chickens Out") trade. The market's focus in now on this latest escalation, so monitoring the developments will be key and will offer trading opportunities. The risk sentiment will likely stay on the defensive until we get some clear de-escalation from Trump. If things escalate further, we should see more downside before Trump eventually folds.
As a reminder, the US cash equity markets are closed today for Martin Luther King Jr. Day.
NASDAQ TECHNICAL ANALYSIS – DAILY TIMEFRAME
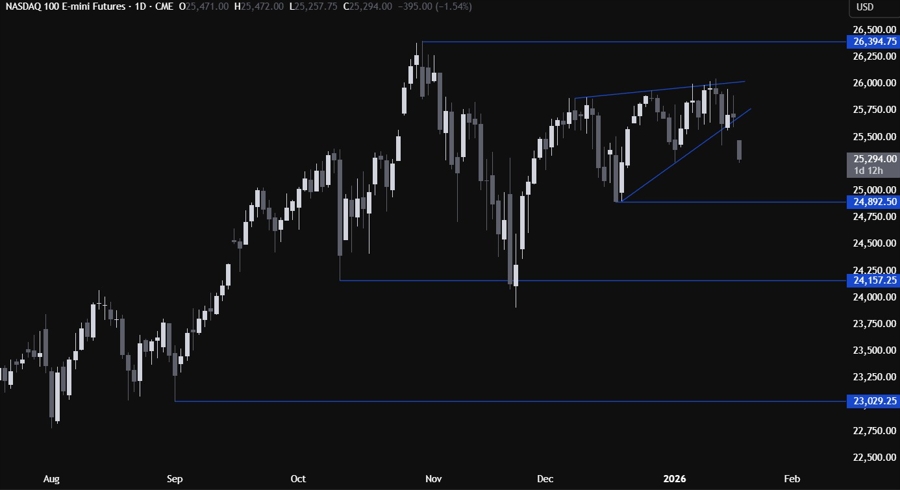
On the daily chart, we can see that the Nasdaq broke out of the rising wedge to the downside following Trump’s escalation over Greenland. The natural target is generally the base of the wedge, which in this case stand around the 24,900 level. We might need further escalation or just no positive developments to keep the bearish pressure intact.
If the price gets there, we can expect the dip-buyers to step in with a defined risk below the 24,900 level to position for a rally into new all-time highs. The sellers, on the other hand, will look for a break lower to increase the bearish bets into the 24,200 level next.
NASDAQ TECHNICAL ANALYSIS – 4 HOUR TIMEFRAME
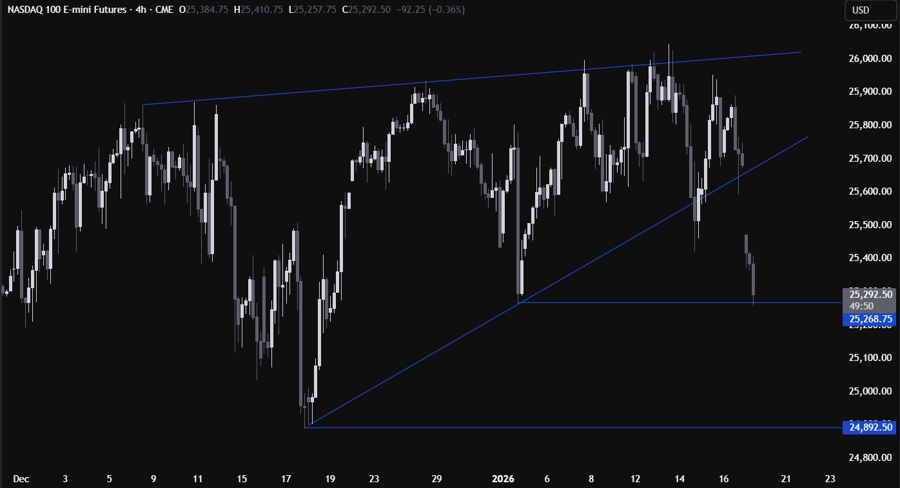
On the 4 hour chart, we can see that the price has fallen to the first key swing level around 25,270. This is going to be the first dip-buying opportunity with a defined risk below the swing level. The sellers, on the other hand, will want to see the price breaking lower to increase the bearish bets into the 24,900 level next.
NASDAQ TECHNICAL ANALYSIS – 1 HOUR TIMEFRAME
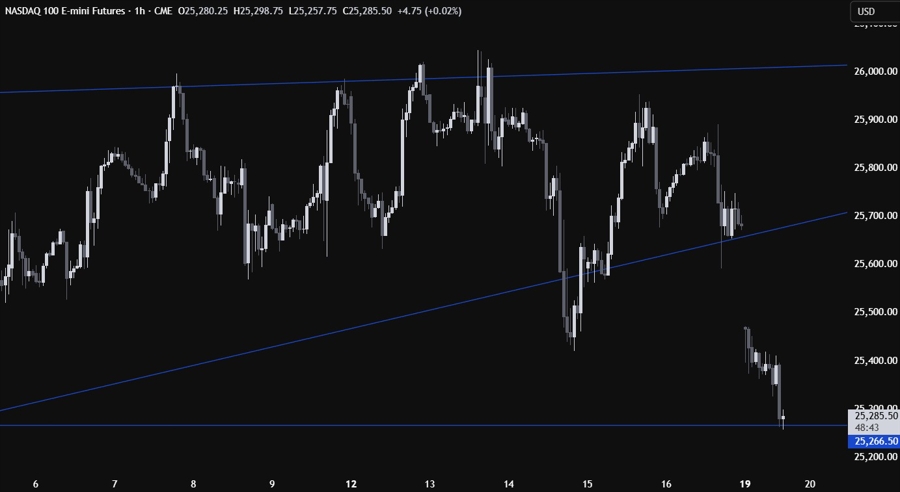
On the 1 hour chart, there’s not much we can add here as the buyers will likely start piling in around these levels to position for a rally into new highs, while the sellers will wait for a break lower to increase the bearish bets into the next key level.
UPCOMING CATALYSTS
Tomorrow we have the weekly US ADP jobs data. On Thursday, we get the latest US Jobless Claims figures. On Friday, we have the US Flash PMIs. Watch out also for headlines and Trump’s posts on Truth Social regarding Greenland as the market’s focus remains on this latest trade war.
