
FUNDAMENTAL OVERVIEW
We’ve had a rough three-day losing streak for the Nasdaq and other major stock market indices. It’s not clear what was the catalyst although it coincided with the release of Anthropic's new AI tool called Claude Plugins. It basically demonstrated that a large portion of software could be obsolete and weighed on tech stocks.
In reality, there were already cautionary signs as the market was diverging with credit spreads which have been signalling some tightening in financial conditions. In fact, the US economic surprise index recently jumped to the highest level since November 2023. That led to some hawkish repricing in interest rates expectations.
Next week is going to be a big one as we get the US NFP report on Wednesday and the US CPI on Friday. Another hawkish repricing could weigh on the market. The best outcome for the bulls should be some benign jobs data coupled with a softer than expected inflation report.
In fact, we should be in a “good news is good news” environment for the stock market amid the Fed’s dovish reaction function as long as inflation continues to slowly head towards target. A quick deterioration in the labour market at this point could trigger growth fears and lead to a deeper correction.
NASDAQ TECHNICAL ANALYSIS – DAILY TIMEFRAME
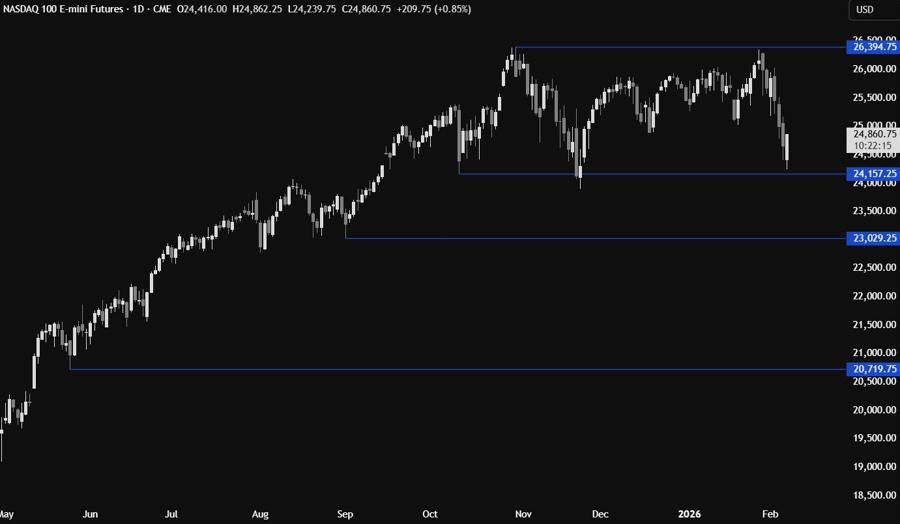
On the daily chart, we can see that the Nasdaq fell all the way back to November lows. The dip-buyers stepped in near those lows to position for a rally into new all-time highs. The sellers will want to see the price breaking lower to open the door for a drop into the 23,000 level next.
NASDAQ TECHNICAL ANALYSIS – 4 HOUR TIMEFRAME
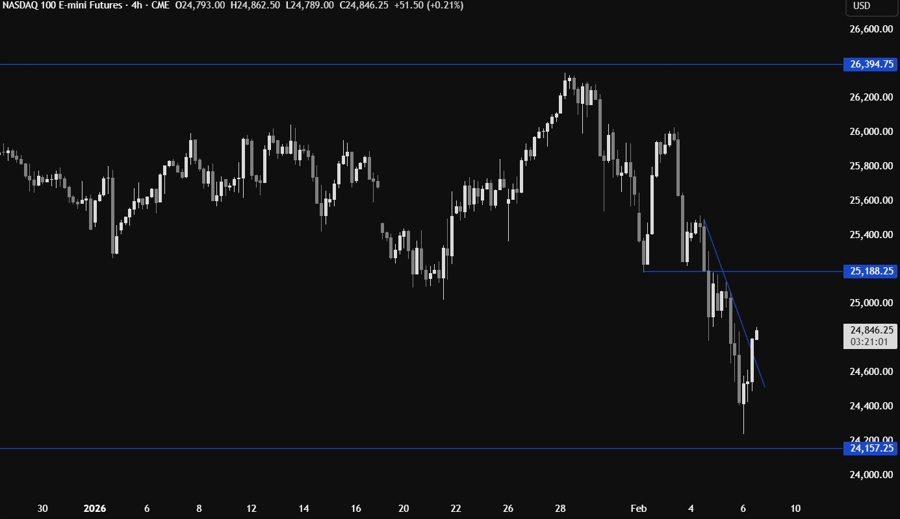
On the 4 hour chart, we can see that the bullish momentum picked up after the price broke above the minor downward trendline as more buyers piled in. The target should be the resistance around the 25,188 level. If the price gets there, we can expect the sellers to step in with a defined risk above the resistance to position for a drop into new lows. The buyers, on the other hand, will look for a break higher to increase the bullish bets into new highs.
NASDAQ TECHNICAL ANALYSIS – 1 HOUR TIMEFRAME
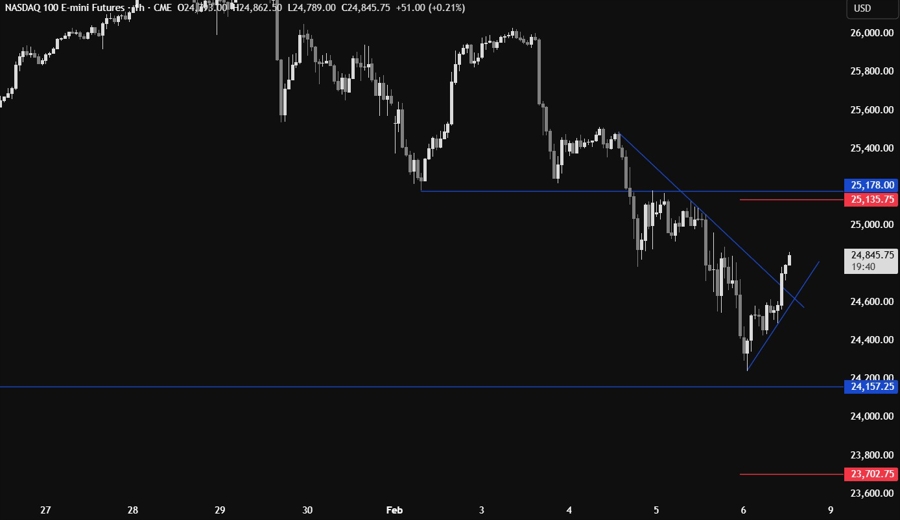
On the 1 hour chart, we can see that we have a minor upward trendline defining the bullish momentum on this timeframe. The buyers will likely continue to lean on the trendline to keep pushing into new highs, while the sellers will look for a break lower to pile in for a drop back into the November lows. The red lines define the average daily range for today.
UPCOMING CATALYSTS
Today we conclude the week with the University of Michigan Consumer Sentiment survey.


