
FUNDAMENTAL OVERVIEW
The Nasdaq surged into new highs yesterday after the announcement of a two-week ceasefire. However, the market didn’t extend the gains as some negative news weighed a bit on the risk sentiment.
The main culprit was Israel launching a large wave of strikes on Lebanon, triggering backlash, with Iran insisting that Lebanon was included in the ceasefire agreement.
For now, the ceasefire is still holding, at least until tomorrow, when the US-Iran negotiations are set to take place in Islamabad. The talks could also be extended if both sides agree. This is keeping markets in check.
There’s still a risk that the conflict could restart at any moment, since the US and Iran have not officially ended the hostilities. Nonetheless, the short-term bias has turned more bullish, as traders reprice the negative growth expectations. Having said that, the sentiment could reverse quickly if negotiations fail and the war resumes, so all eyes will be on Islamabad tomorrow.
NASDAQ TECHNICAL ANALYSIS – DAILY TIMEFRAME
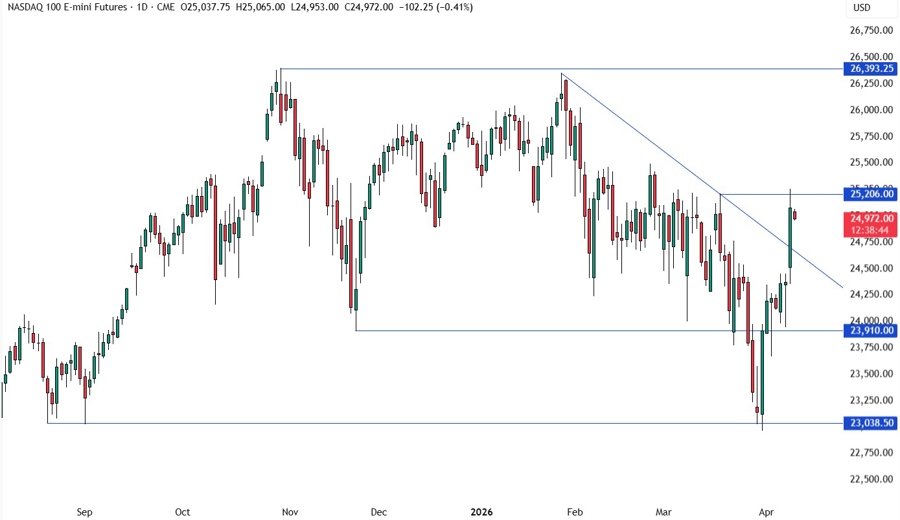
On the daily chart, we can see the Nasdaq surged into the 25,200 level following the ceasefire announcement before pulling back a bit. The sellers stepped in around the 25,200 level with a defined risk above it to position for a drop into new lows. The buyers, on the other hand, will look for a break higher to increase the bullish bets into new all-time highs.
NASDAQ TECHNICAL ANALYSIS – 4 HOUR TIMEFRAME
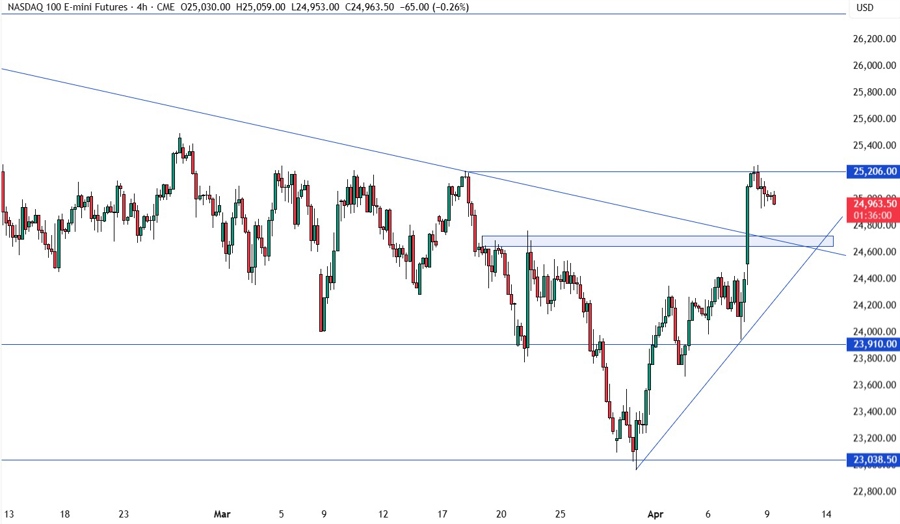
On the 4 hour chart, we have a minor support zone around the 24,700 level where we can also find the broken downward trendline. If the price gets there, we can expect the buyers to step in with a defined risk below the support to keep pushing into new highs. The sellers, on the other hand, will look for a break to extend the pullback into the upward trendline.
NASDAQ TECHNICAL ANALYSIS – 1 HOUR TIMEFRAME
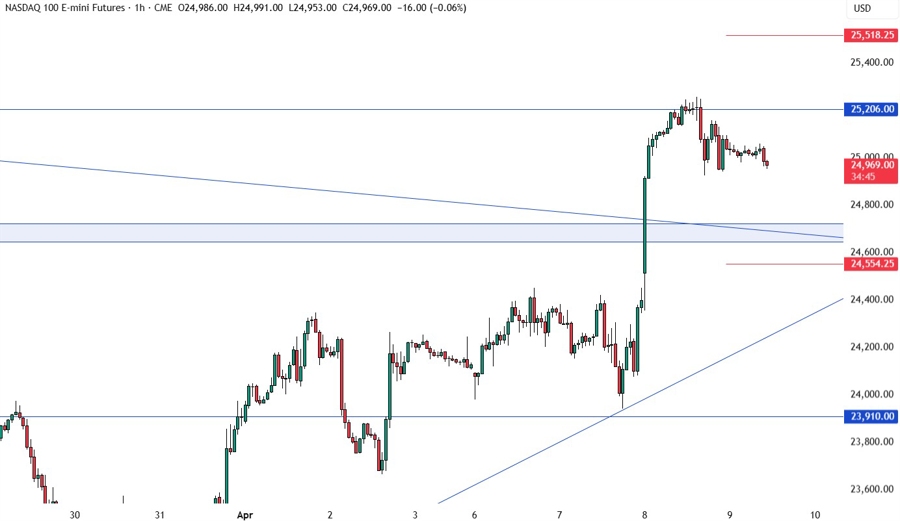
On the 1 hour chart, there’s not much we can add here as from a risk management perspective, the buyers will have a better risk to reward setup around the support or the upward trendline, while the sellers will look for downside breaks to increase the bearish bets into new lows. The red lines define average daily range for today.
UPCOMING CATALYSTS
Today we get the US PCE price index and the latest US Jobless Claims figures. Tomorrow, we conclude the week with the US CPI report and the University of Michigan Consumer Sentiment survey. As a reminder, we have also the US-Iran negotiations in Islamabad tomorrow which is going to be more important than the economic data.


