
FUNDAMENTAL OVERVIEW
The Nasdaq has been slowly erasing Monday’s gains as traders have been getting increasingly worried of an escalation over the weekend. Trump has been jawboning the markets throughout the entire week with ceasefire comments and claims that Iran has been “begging” him for a deal. Meanwhile, the US military buildup in the Middle East increased the speculations of a potential ground invasion.
Late yesterday, Trump extended the ceasefire through April 6, right as major equity indices were on the verge of breaking to new monthly lows and Treasury yields were pushing toward fresh highs. He claimed Iran requested the extension, though Iranian officials denied it.
It looked like another attempt to jawbone the markets, but this time it didn’t have the same impact as earlier in the week and the gains were quickly faded. With oil prices pushing into new daily highs, we might see more hedging into the weekend which is likely to put pressure on the Nasdaq throughout the day.
NASDAQ TECHNICAL ANALYSIS – DAILY TIMEFRAME
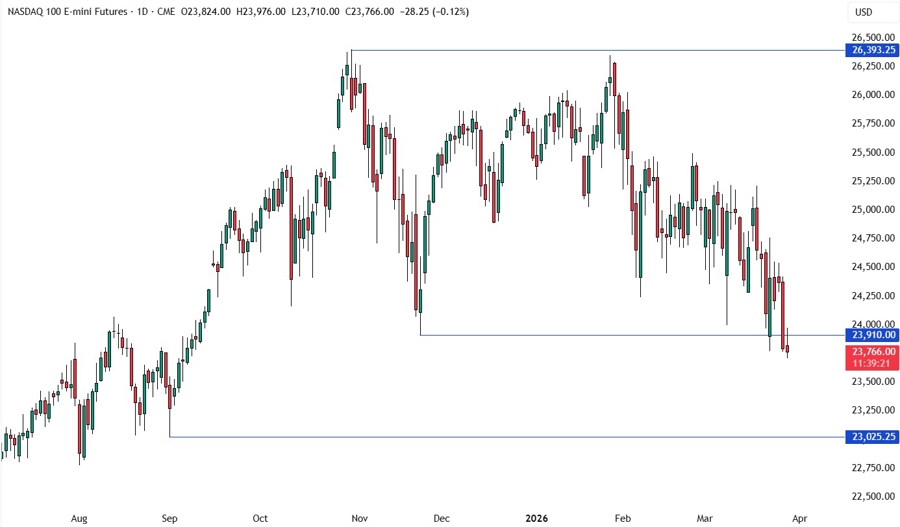
On the daily chart, we can see that the Nasdaq just made a new monthly low today as traders are getting increasingly worried about a ground invasion. We can expect the sellers to keep piling in around these levels with a defined risk above the 23,910 level targeting the 23,025 level next. The buyers, on the other hand, will want to see the price rising back above the 23,910 level to position for a rally back into the 25,000 level next.
NASDAQ TECHNICAL ANALYSIS – 4 HOUR TIMEFRAME
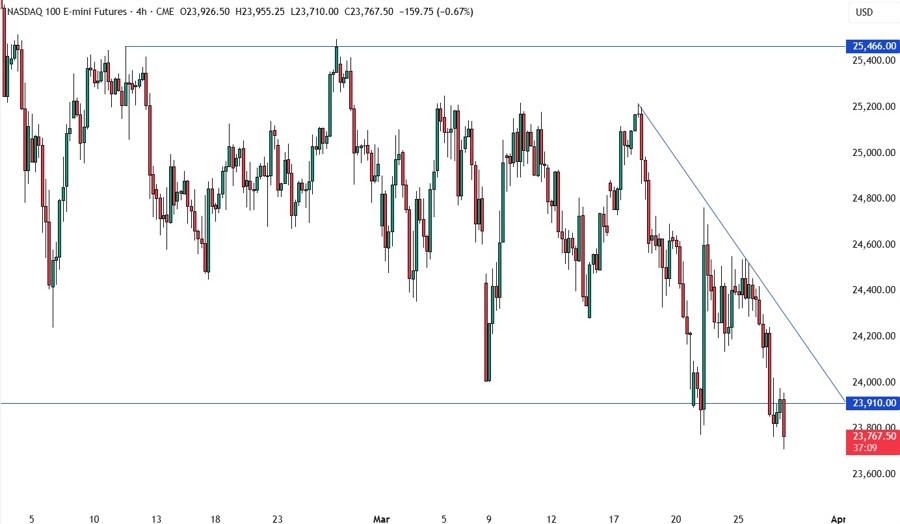
On the 4 hour chart, we have a downward trendline defining the bearish structure. If we get a pullback, we can expect the sellers to lean on the trendline with a defined risk above it to keep pushing into new lows. The buyers, on the other hand, will look for a break higher to increase the bullish bets into the 25,000 level next.
NASDAQ TECHNICAL ANALYSIS – 1 HOUR TIMEFRAME
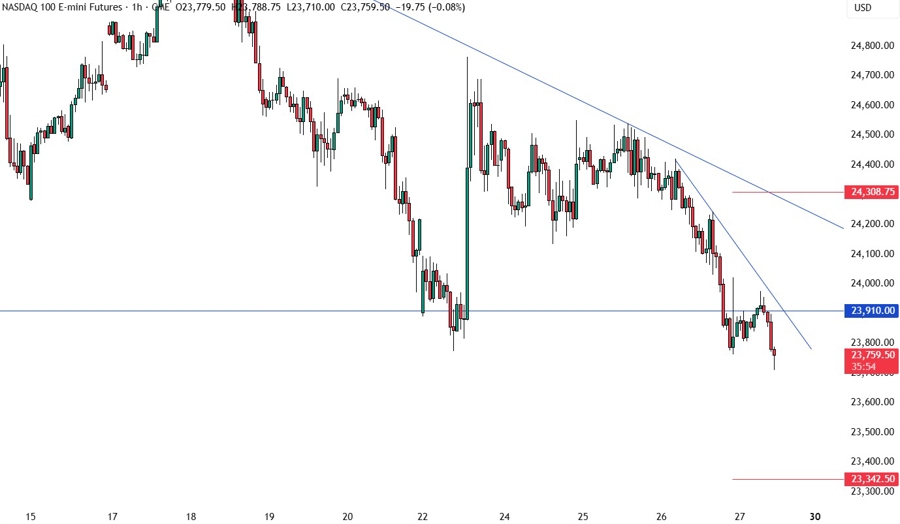
On the 1 hour chart, we have a minor downward trendline defining the bearish momentum on this timeframe. The sellers will likely continue to lean on the trendline to keep pushing into new lows, while the buyers will look for a break to extend the pullback into the next major trendline next. The red lines define average daily range for today.


