
KEY POINTS:
- DAX touches a new all-time high
- Breakout of the 2025 range in focus
- Positive risk sentiment is providing support amid Fed's easing, neutral ECB
FUNDAMENTAL OVERVIEW
The German DAX touched a new all-time high today but couldn’t sustain the breakout of the 2025 range. There was strong optimism in the first half of 2025 due to the German fiscal stimulus, but the enthusiasm eventually faded and the index remained stuck in a big range.
The German economy is expected to gradually pick up in 2026 according to the German central bank, but the real risk this year is going to be the ECB. In fact, despite the expectations of the European Central Bank to keep interest rates steady throughout 2026, there is a risk flagged by ECB’s Schnabel that we could see rate hikes earlier than expected, although this might be a risk for the second half of the year.
As long as the ECB keeps its neutral stance and the Fed maintains its dovish reaction function, the positive risk sentiment should continue to support the upside for the stock market.
DAX TECHNICAL ANALYSIS – DAILY TIMEFRAME
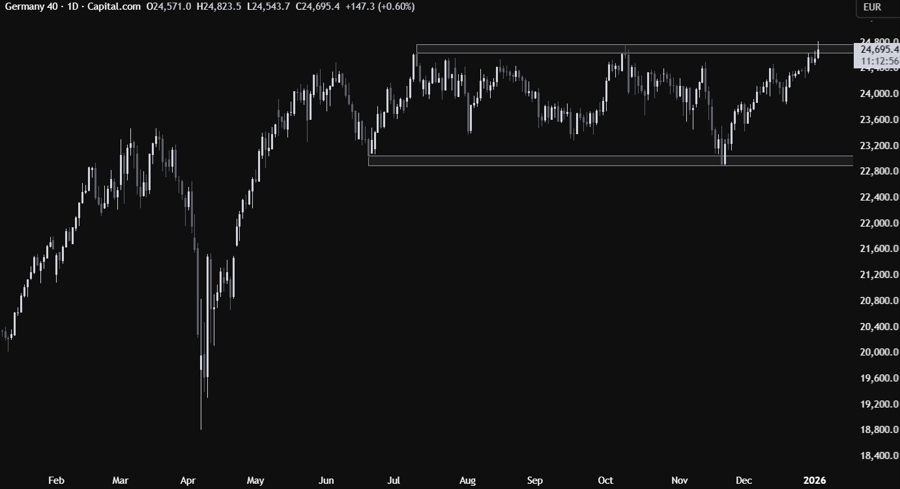
On the daily chart, we can see that the DAX (CFD contract) probed above the upper bound of the range reaching a new all-time high but eventually gave back the gains as the buyers couldn’t sustained the breakout. The sellers will likely step in here with a defined risk above the resistance to position for a drop back into the lower bound of the range. The buyers, on the other hand, will look for a break higher to increase the bullish bets into new all-time highs.
DAX TECHNICAL ANALYSIS – 4 HOUR TIMEFRAME
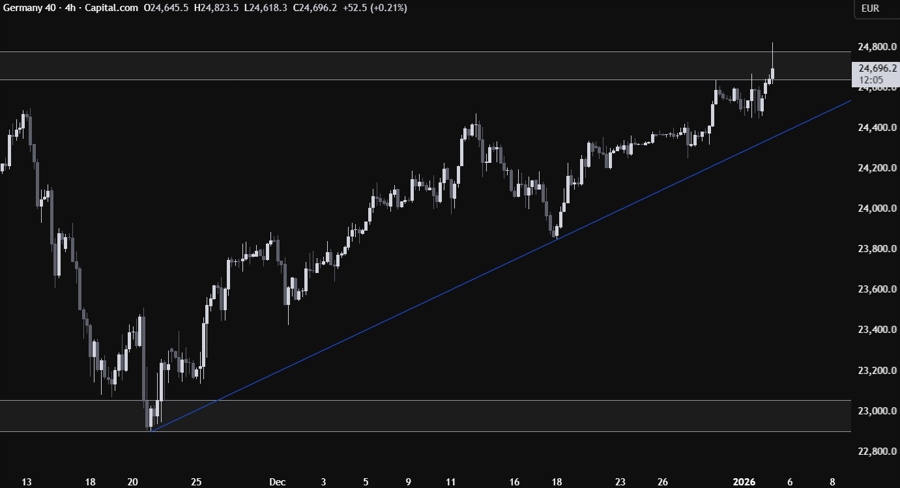
On the 4 hour chart, we can see that we have an upward trendline defining the bullish momentum. If we get a pullback into the trendline, we can expect the buyers to lean on it with a defined risk below it to position for a rally into new all-time highs with a better risk to reward setup. The sellers, on the other hand, will look for a break lower to increase the bearish bets into the lower bound of the range around the 23000 level.
DAX TECHNICAL ANALYSIS – 1 HOUR TIMEFRAME
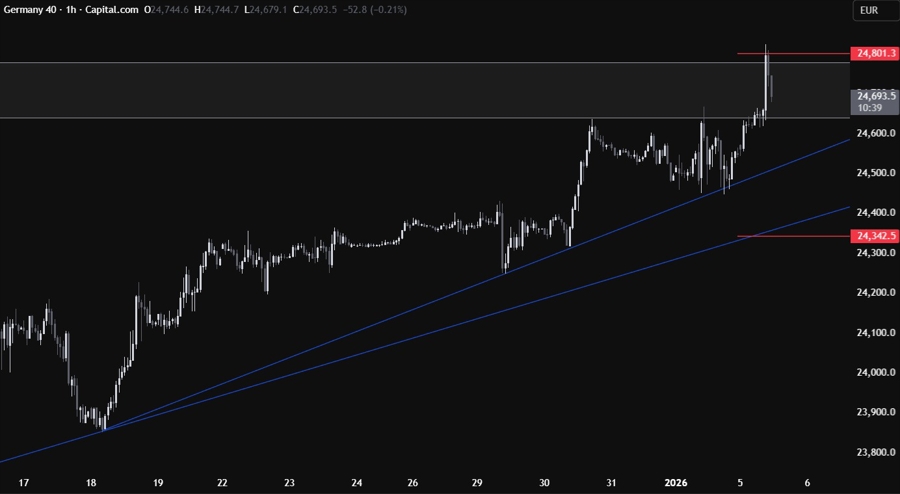
On the 1 hour chart, we can see that we have another minor trendline defining the bullish momentum on this timeframe. The buyers might split their orders in half in case the minor trendline gets breached and the price drops to the major one. The sellers, on the other hand, will keep on piling in at every break lower to target the lower bound of the range. The red lines define the average daily range for today.
UPCOMING CATALYSTS
Today we get the US ISM Manufacturing PMI. Tomorrow, we get the inflation reports for the major European economies. On Wednesday, we have the Eurozone Flash CPI, the US ADP, the US ISM Services PMI and the US Job Openings data. On Thursday, we get the latest US Jobless Claims figures. On Friday, we conclude the week with the US NFP report.
