
KEY POINTS:
- Australia inflation data in focus tomorrow
- The market is pricing 32% probability of a rate hike in February
- Total tightening expected in 2026 is around 42 bps
- ASX 200 is trading inside a rising channel
- Soft data is expected to trigger a rally, while hot figures will likely add more pressure
FUNDAMENTAL OVERVIEW
The ASX 200 went into a meaningful drawdown back in November following the hot inflation data at the end of October. That triggered a hawkish repricing in interest rate expectations which were then followed by a more hawkish RBA decision. The central bank even discussed whether a rate hike might be needed at some point in 2026.
The market is pricing a 32% probability of a rate hike at the upcoming meeting in February with a total of 43 bps of tightening seen by year-end. Tomorrow, we get the monthly Australian inflation data. Even though the RBA focuses more on the quarterly reports, traders will likely react to the monthly report.
Given the hawkish expectations, a soft report will likely have a bigger impact on Australian assets. In such a case, we will likely see the ASX 200 rallying as the hawkish expectations fade. On the other hand, another hot report will likely weigh further on the stock market, potentially taking it back to November lows.
ASX 200 TECHNICAL ANALYSIS – DAILY TIMEFRAME
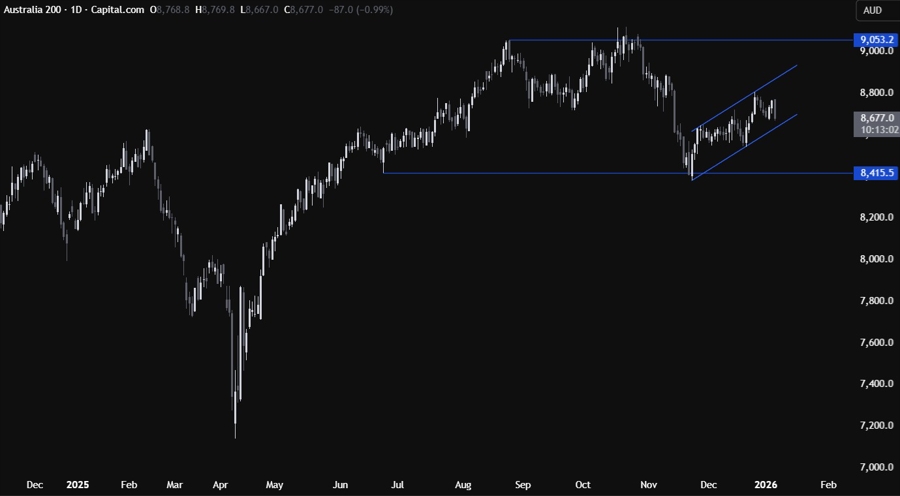
On the daily chart, we can see that the ASX 200 (CFD contract) has been trading inside a rising channel. From a risk management perspective, the buyers will have a better risk to reward setup around the bottom trendline to position for a rally into new all-time highs, while the sellers will look for a break below the trendline to push the price back into the 8415 level.
ASX 200 TECHNICAL ANALYSIS – 4 HOUR TIMEFRAME
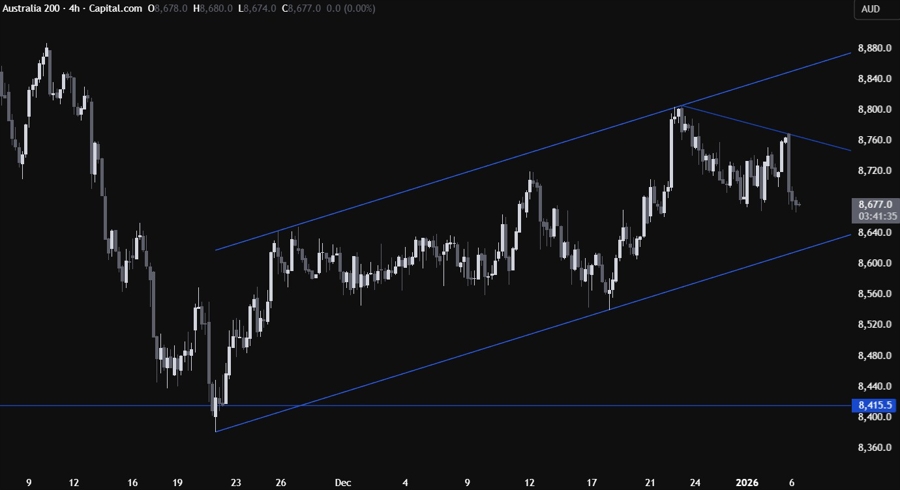
On the 4 hour chart, we can see that we have a downward trendline defining the pullback into the lower bound of the channel. If the price rallies into the downward trendline, we can expect the sellers to lean on it with a defined risk above it to position for a drop into the lower bound of the channel. The buyers, on the other hand, will want to see the price breaking higher to increase the bullish bets into the upper bound of the channel.
ASX 200 TECHNICAL ANALYSIS – 1 HOUR TIMEFRAME
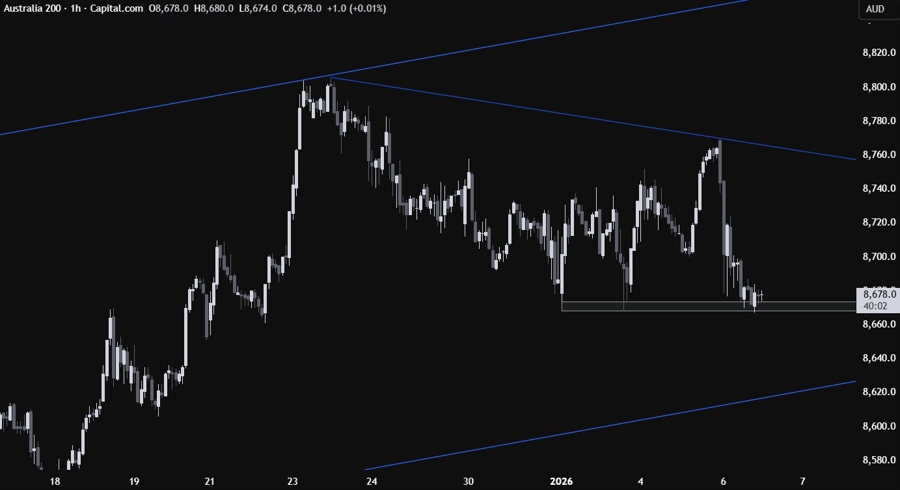
On the 1 hour chart, we can see that we have a minor support zone around the 8670 level. The buyers will likely continue to step in around this level with a defined risk below it to keep targeting the downward trendline, while the sellers will wait for a break lower to extend the drop into the bottom of the channel.
UPCOMING CATALYSTS
Tomorrow we have the Australian monthly inflation data, the US ADP, the US ISM Services PMI and the US Job Openings data. On Thursday, we get the latest US Jobless Claims figures. On Friday, we conclude the week with the US NFP report.


