
Key Takeaways for AMD Stock Investors (watch my video)
Advanced Micro Devices (AMD) is trading below a broken multi-month channel, keeping the medium-term technical bias bearish.
A confirmed bear flag breakdown from December remains active after a clean retest failure.
AMD is showing relative weakness versus major indices, despite occasional short-term bounces.
With earnings approaching in early February, event risk is elevated and price reaction will be critical. Oh, and, of course, investors, traders and some algos have stops just below the $200 round psychological number, and the current price $204.68 (close of 08 Jan, 2026) is getting close...
Bear Flag Breakdown and Retest: Why the Signal Matters
After the December breakdown, AMD formed a classic bear flag pattern. These patterns often resolve lower after a temporary consolidation, especially when they occur after an extended uptrend.
In early January, AMD delivered a near-textbook retest of the former channel and bear flag resistance. Sellers defended that area convincingly, and price rolled over again. This failed retest is a critical confirmation signal. If buyers were regaining control, AMD would likely have reclaimed the channel quickly or avoided the sharp pullback that followed.
Instead, the stock declined roughly 13% from that retest area, a meaningful move for a large-cap semiconductor name, particularly while broader equity indices held up relatively better.
Regression Channel Analysis: Mapping the Current AMD Trend
A regression channel using three standard deviations further reinforces the bearish technical structure. Price remains encapsulated within a downward-sloping regression path, with the mid-channel acting as dynamic resistance.
Short-term scenarios still exist. AMD could see tactical bounces toward the mid-regression line or attempt another touch of the smaller declining channel overhead. However, unless price can sustain acceptance above those levels, such moves are best viewed as corrective rather than the start of a new bullish trend.
Key AMD Stock Price Support and Resistance Levels Investors Should Watch
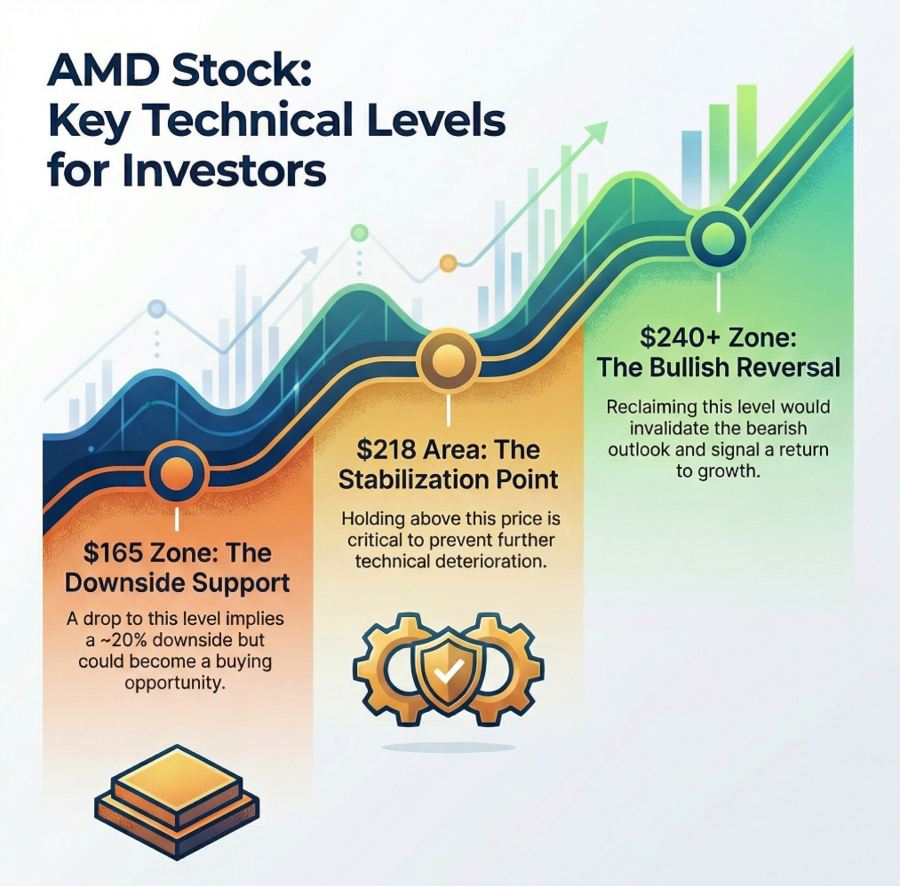
From a technical investor perspective, several levels stand out:
$218 area: A reclaim and sustained hold above this zone would help stabilize the structure and prevent further technical deterioration.
$240 and above the November 20 high: This zone marks the threshold required to invalidate the broader bearish thesis and re-enter the prior rising channel.
$165 zone: This level corresponds to the base of a sharp upside spike driven by AI-related news. A full retracement of that move would imply an additional ~20% downside from current levels. While bearish in the short term, this area could later become a high-interest zone for longer-term investors, pending confirmation.
AMD Stock Earnings Risk: Why Price Reaction Matters More Than Headlines
AMD’s upcoming earnings report in early February adds an important layer of uncertainty. Revenue, EPS, AI exposure, and forward guidance will matter, but the market’s reaction to those results matters more than the numbers themselves.
Strong earnings followed by weak price action would reinforce the bearish technical message. Conversely, a sustained reclaim of major resistance levels after earnings would be the first meaningful signal that sentiment and structure are shifting.
AMD Stock Technical Outlook Summary for Stock Investors
As long as AMD remains below the broken channel, bear flag resistance, and key reclaim levels, the technical outlook remains more bearish than bullish on a medium-term basis. Short-term rallies may occur, but without structural follow-through, they do not alter the broader risk profile.
This analysis represents one technical perspective, not a prediction. Markets are dynamic, and investors should combine technical signals with fundamental research, earnings context, and disciplined risk management when evaluating AMD stock.
