
FUNDAMENTAL OVERVIEW
The Nasdaq surged into a new all-time high amid US-Iran deal optimism. The US-Iran war has been pushing the market lower on negative growth expectations and as those expectations now get repriced on the positive side, the stock market has room to run. The playbook is very similar to April 2025.
The second round of negotiations were expected to begin today but we never had an official date. They are expected to happen before the April 22 ceasefire deadline though.
In the meantime, we got reports that US and Iranian negotiators made progress in talks on Tuesday and they were moving closer to a framework agreement to end the war. A US official has also mentioned that if a framework agreement is reached, the ceasefire would need to be extended to negotiate the details of a comprehensive deal.
Everything now hinges on US-Iran talks. If negotiations were to break down again, we might see a selloff, but as long as the ceasefire holds, the downside should remain limited. On the other hand, a peace deal might give the Nasdaq another boost to push into new highs although a “sell the fact” type of reaction remains a risk given the extreme positioning.
NASDAQ TECHNICAL ANALYSIS – DAILY TIMEFRAME
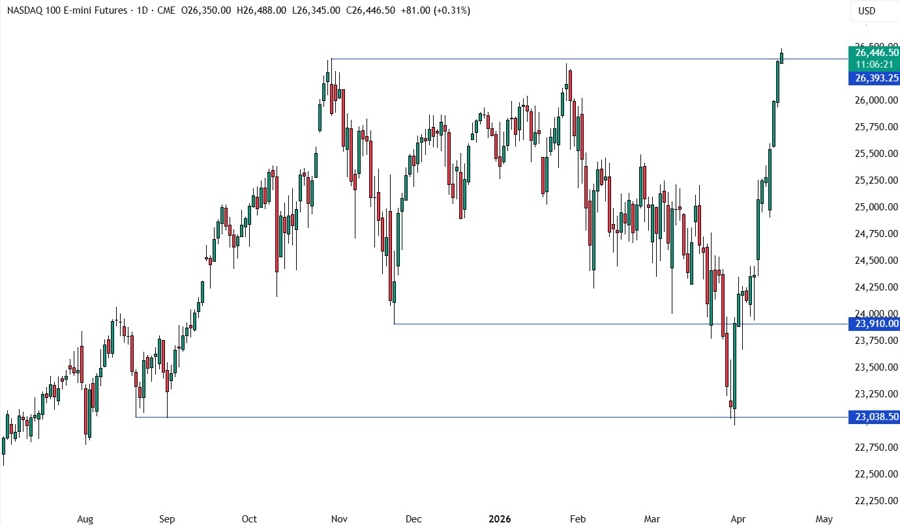
On the daily chart, we can see the Nasdaq surged into a new record high after an incredible rally since the start of April. We can expect the sellers to step in if the price falls back below the 26,400 level to position for a drop into the 25,500 level. The buyers, on the other hand, will likely increase the bullish bets here to keep pushing into new highs, although a pullback would offer a better risk to reward setup.
NASDAQ TECHNICAL ANALYSIS – 4 HOUR TIMEFRAME
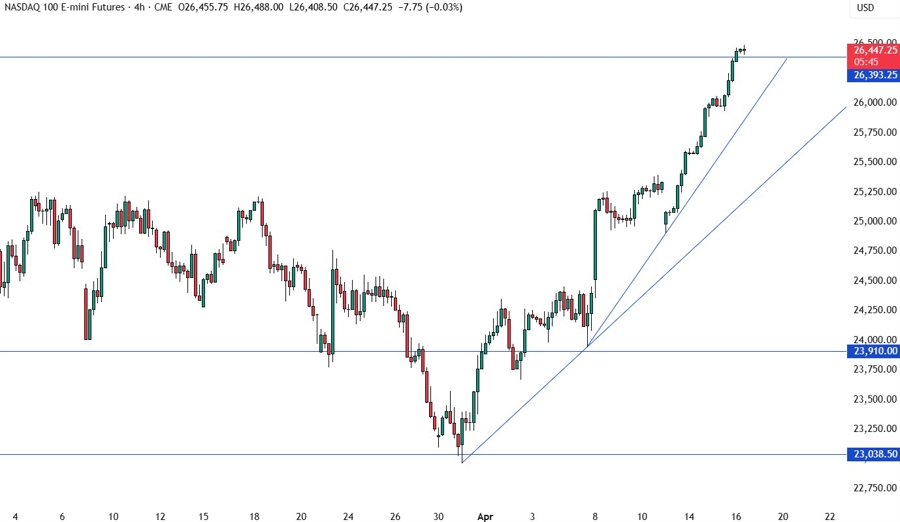
On the 4 hour chart, we have a couple of trendlines that could act as support for dip-buyers. In fact, if we get a pullback from the all-time highs, we can expect the buyers to lean on the first trendline with a defined risk below it to keep pushing into new highs. The sellers, on the other hand, will look for a break lower to extend the pullback into the next trendline where we should find again the dip-buyers.
NASDAQ TECHNICAL ANALYSIS – 1 HOUR TIMEFRAME
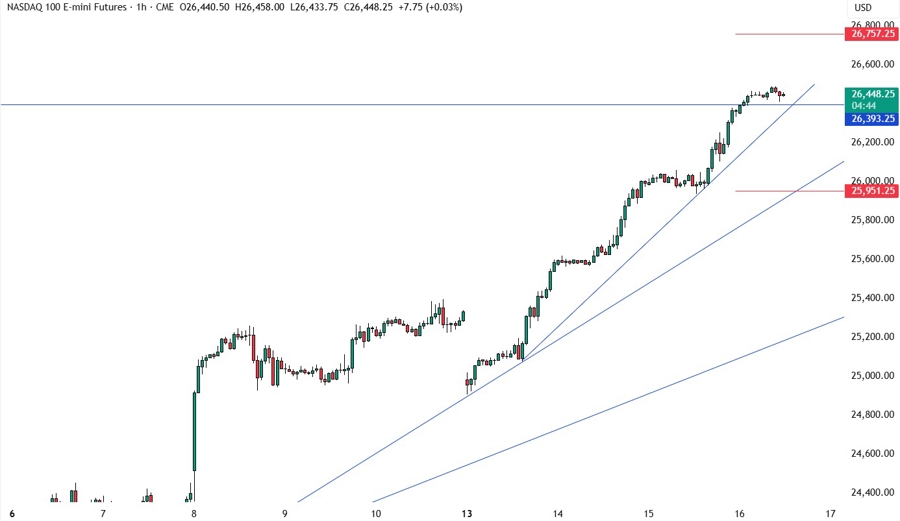
On the 1 hour chart, we have yet another minor trendline defining the bullish momentum on this timeframe. The buyers will likely continue to lean on it with a defined risk below it to keep pushing into new highs, while the sellers will look for a break to extend the pullback into the next trendline. The red lines define average daily range for today.
UPCOMING CATALYSTS
Today we get the latest US Jobless Claims figures, but the focus remains on US-Iran headlines.


