The major US stock indices are tumbling with the NASDAQ index now down -2.36% and the S&P down -1.65%. Both are trading at session lows.
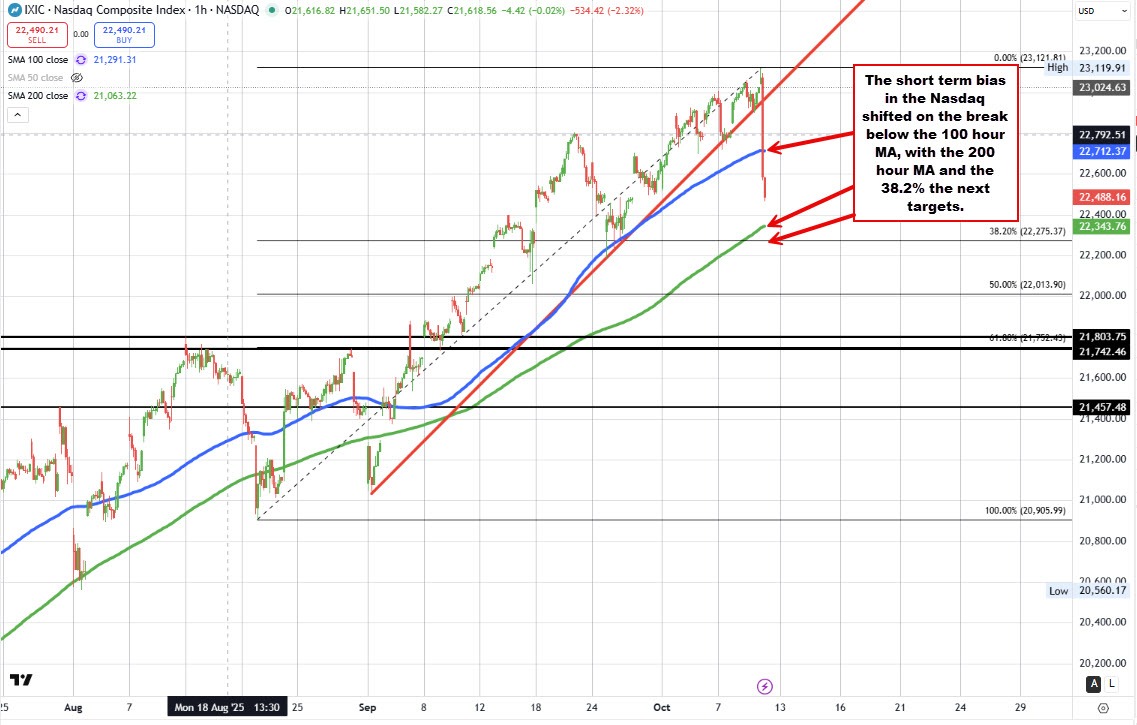
On the hourly chart, the NASDAQ has broken below its 100-hour moving average at 22,712.15 and is now approaching the 200-hour moving average at 22,343.72. Just below sits the 38.2% retracement of the recent uptrend at 22,275.37, adding to the downside watch zone. Notably, the last time the index traded below its 200-hour MA was on September 2, before quickly rebounding on September 3 and beginning the surge to new all-time highs.
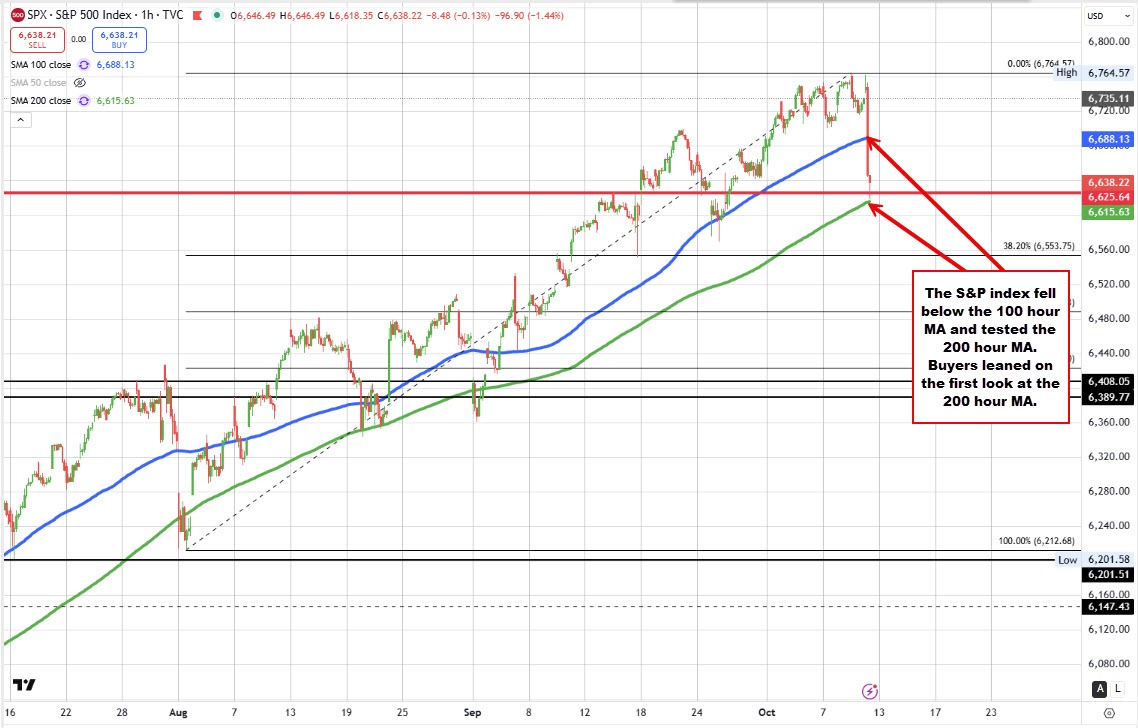
The S&P 500 has also slipped under its 100-hour moving average and tested its 200-hour MA at 6,615.60. Today’s low of 6,618.12 came within striking distance of that support. A clear break below the 200-hour MAs on both indices would shift momentum further bearish and open the door to deeper corrective pressure.