
The Nasdaq index moved to a low for the day at 23315.28. That took the price down -211.90 at session lows.
The price has rebounded off that low, and currently trades at 23392 (the price just traded to 23420). At that corrective high, the price tested the 100 hour and 50 hour MA (blue and black MA on the chart below) which come in at 23425 and 23412 respectively. Sellers leaned.
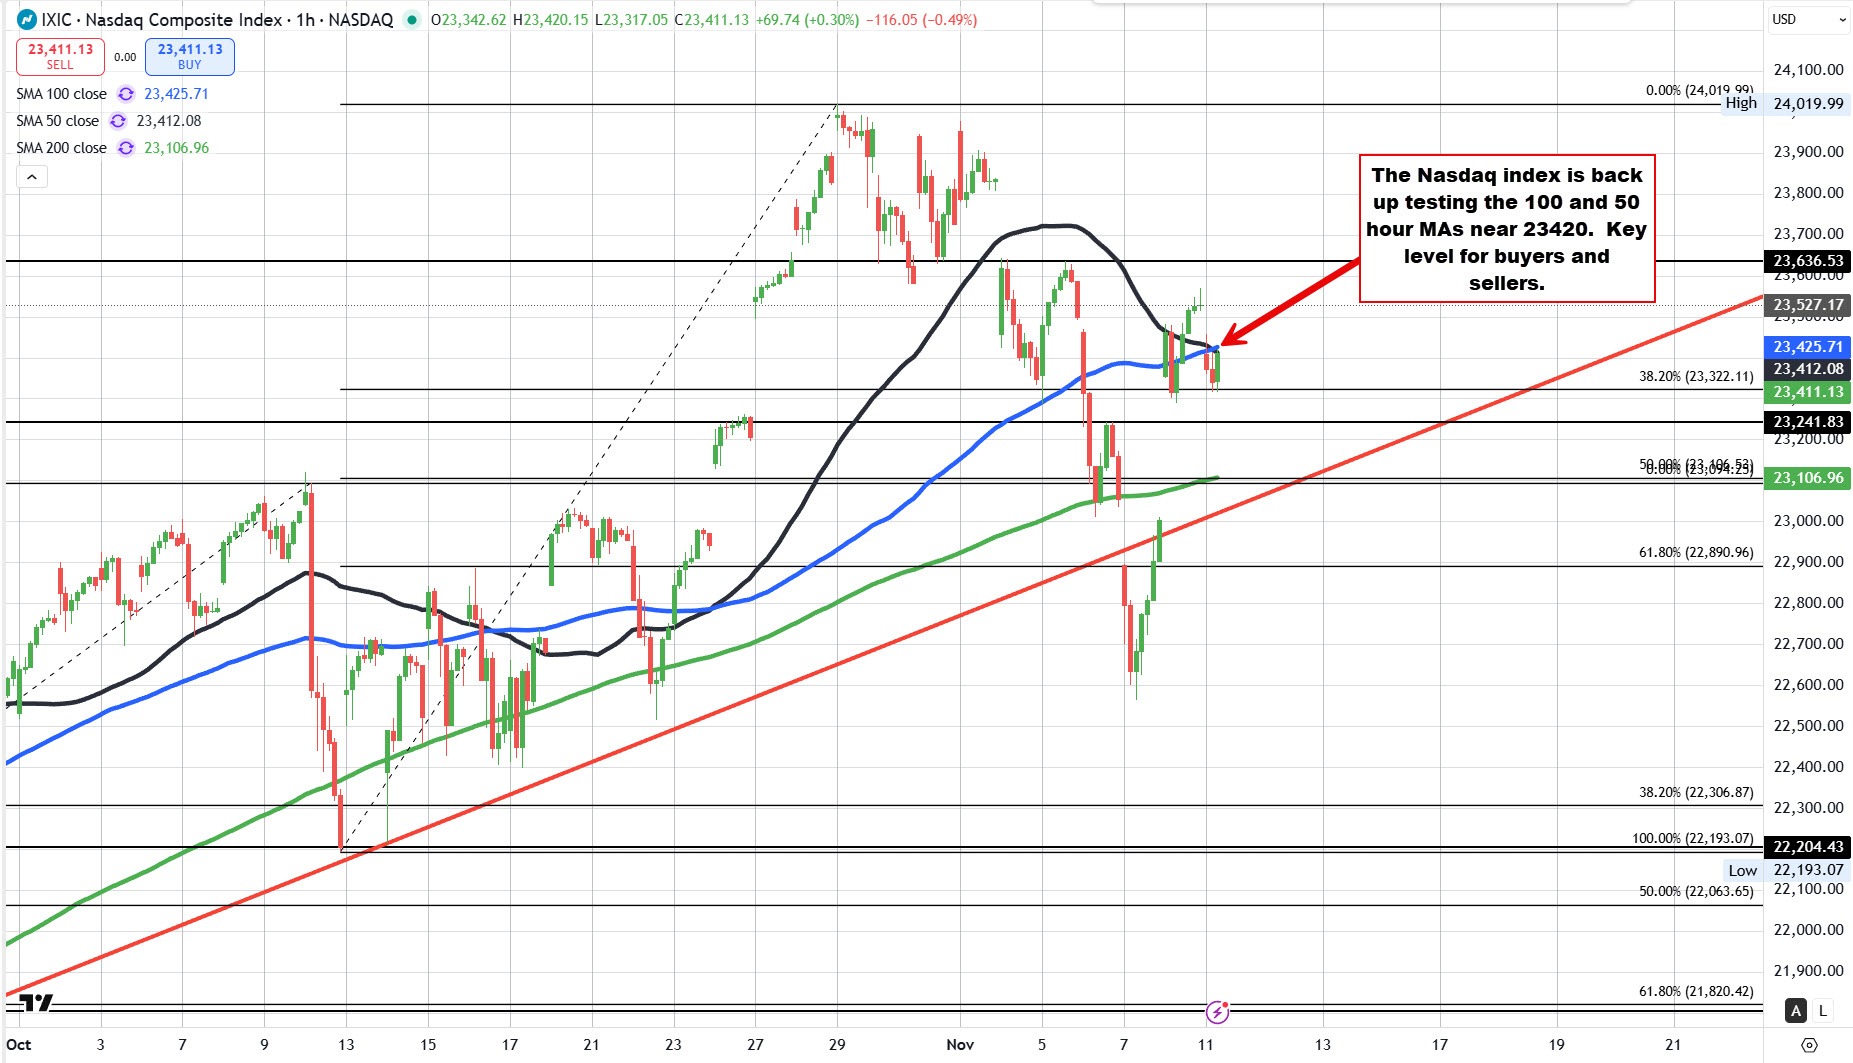
That level is a key level for buyers and sellers on the correction. If the price can stay below the MAs, the sellers are in play and have an edge.
Conversely, if the price does move above those MAs, the bias will shift back in favor of the buyers.
Key area for both. Be aware.


