The major US stock indices are modestly lower in trading to kickstart the new trading day. The declines are led by the NASDAQ in the small-cap Russell 2000. A snapshot of the market currently shows:
- Dow industrial average is trading down -62.2 or -0.13% at 46863. Yesterday the Dow industrial average closed at a new record high.
- S&P index is trading above and below unchanged at 6735.
- NASDAQ index is down -27 points or -0.12% at 22926.
- Russell 2000 is down -.9.44 points or -0.39% at 2477.
Netflix shares are down sharply after reporting earnings after the close. A summary shows:
- Revenue: Netflix came in at $11.5 billion, meeting Wall Street's expectations with a 17% year-over-year growth. This was driven by price hikes, ad-supported tier growth, and strong demand for original content.
- Earnings Per Share (EPS): Netflix's EPS came short of expectations at $5.87 versus $6.94 estimates due to a $619 million tax charge in Brazil. This tax dispute reduced operating margins and sparked concerns about potential regulatory risks in other markets.
- Ad Revenue: Despite the tax hit, Netflix reported its best-ever quarter for ad sales, with growing user adoption and advertiser partnerships. The ad-supported tier is becoming a meaningful contributor to revenue.
- Subscriber Growth: Although Netflix has stopped reporting subscriber numbers, the company highlighted revenue and engagement metrics instead. Viewership data from Nielsen and Barb showed Netflix gaining share in the US and UK markets.
- Guidance: Netflix forecasts revenue of $11.96 billion for Q4 2025, slightly above Wall Street's projections. The company expects an operating margin of 23.9%, impacted by the Brazil tax charge.
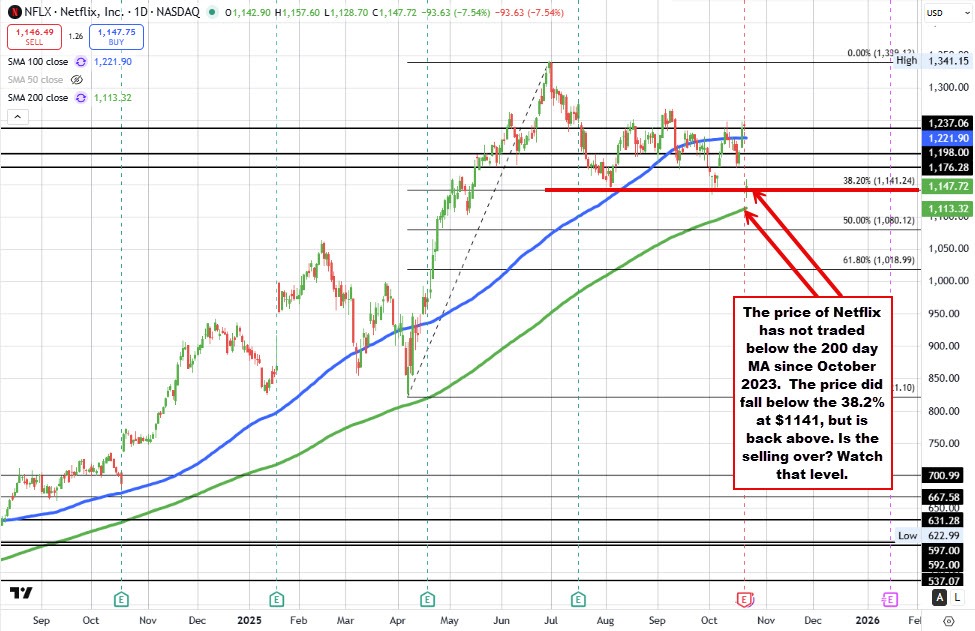
Shares are currently down $93 or -7.46% at $1148.37. Looking at the daily chart, the price gap below the 100 day moving average at $1221.94, and also below the 38.2% retracement of the move up from the April low at $1141.24. The 200 day moving average comes in lower at $1113.36. The price has not traded below its 200 day moving average since October 19, 2023. Be aware.
With the current price trading back above the 38.2% retracement, there may be some feeling that the buyers are buying the dip. For buyers staying above that retracement level at $1141 would be a key barometer for more bullish or more bearish in the short term at least.
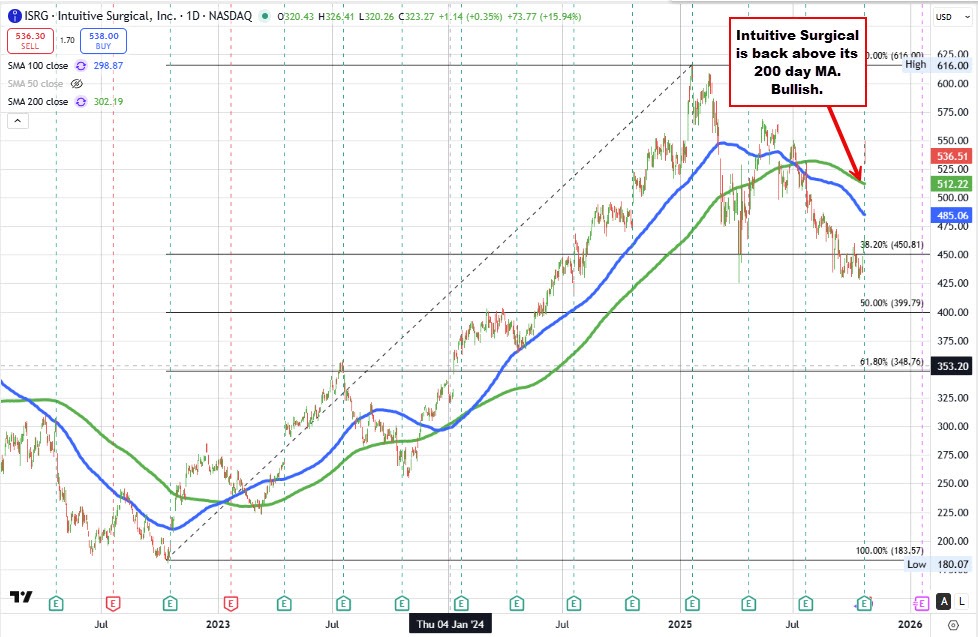
Intuitive Surgical's story is the opposite after it beat on the top and bottom lines. It's shares rising $74.57 or 16.11% to $537.30. That has taken the price back above its 200 day moving average at $512.22 (Green line on the chart below). That moving average is now close support. Staying above with it keeps the buyers more in control.