
Retail Sales data for the month of October 2025 from the US Census Bureau
- Prior month retail sales (September) 0.2% revised to 0.1%
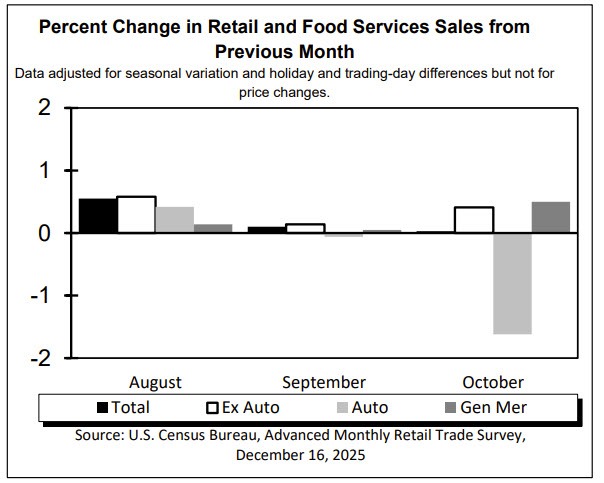
- Retail sales for the month of October 0.0% versus 0.1% estimate.
- Retail sales ex autos 0.4% vs 0.3% expected. Prior month 0.3% revised lower to 0.1%
- Retail sales ex autos and gas 0.5% vs 0.0% last month (revised from 0.1%).
- Control group (feeds into US GDP) 0.8% vs 0.4% estimate. Last month -0.1%
Looking at some of the details from the line items (Census Bureau)
Motor vehicle & parts dealers: -1.6% — a notable drag on the headline, reflecting weaker auto demand.
Furniture & home furnishings: +2.3% — strong rebound, pointing to resilience in discretionary household spending.
Electronics & appliance stores: +0.7% — moderate improvement after prior softness.
Building materials & garden supplies: -0.9% — continued weakness tied to softer housing-related activity.
Food & beverage stores (groceries): +0.3% — steady essential spending.
Health & personal care: -0.6% — pullback after strong gains in prior months.
Clothing & accessories: +0.9% — discretionary spending improved modestly.
Sporting goods, hobby, books: +1.9% — solid gain, supporting the idea of selective discretionary strength.
General merchandise stores: +0.5% — steady broad-based retail activity.
Nonstore retailers (online): +1.8% — e-commerce remained a key growth driver.
Food services & drinking places: -0.4% — slight decline, hinting at some consumer caution on services spending.
Top gainers (month-over-month)
Furniture & home furnishings: +2.3%
Sporting goods, hobby, books: +1.9%
Nonstore retailers (online): +1.8%
Clothing & accessories: +0.9%
Electronics & appliance stores: +0.7%
General merchandise stores: +0.5%
Retail sales ex-autos: +0.4%
Food & beverage stores (groceries): +0.3%
Retail sales ex-gas: +0.1%
Top decliners (month-over-month)
Motor vehicle & parts dealers: -1.6%
Building materials & garden supplies: -0.9%
Gasoline stations: -0.8%
Health & personal care stores: -0.6%
Food services & drinking places: -0.4%
Unchanged
Retail & food services (headline): 0.0%
Trader takeaway: gains were concentrated in discretionary and online spending, while autos and housing-related categories dragged, explaining the flat headline despite healthier underlying demand.
---------------------------------------------------------------------------------------------------------------------------------
US retail sales: What the report tells traders about the consumer and growth
Why retail sales matter
When on schedule (today's data is from October) US retail sales offer one of the clearest, most timely reads on consumer demand, which drives roughly two-thirds of overall US economic activity. Because the data are released monthly and feed directly into GDP calculations, markets often use the report to reassess growth momentum, Fed policy expectations, and near-term direction for yields, equities, and the US dollar.
Understanding the key components
The headline retail sales figure measures overall spending but can be volatile due to autos and gasoline. For that reason, traders focus more closely on retail sales ex-autos, which provide a cleaner signal of underlying demand, and the control group (excluding autos, gas, building materials, and food services), which feeds directly into GDP’s personal consumption component. A strong control group typically signals solid real economic growth, while weakness can quickly raise recession or slowdown concerns.
What the category breakdown reveals
The internal composition of the report is often as important as the headline. Strength in discretionary categories such as online sales, restaurants, and general merchandise suggests confident consumers and healthy labor income.
By contrast, weakness across multiple categories or reliance on essentials can indicate consumers are becoming more cautious, even if the headline number looks stable.
How traders use the data
For markets, strong retail sales tend to support higher Treasury yields and a firmer USD, particularly if paired with signs of rising prices or wages. Soft or slowing sales usually weigh on yields and the dollar, reinforcing expectations for Fed easing. Ultimately, traders use the report to judge whether the US consumer is powering growth, merely sustaining it, or beginning to pull back, shaping both short-term market moves and broader macro positioning.
The Market reaction:
The USD moved lower initially but has moved back higher after the early reaction to both the retail sales and the US jobs report.
- The EURUSD moved to a high of 1.1794, above a swing area between 1.1779 and 1.1788. However, the price has since moved back down currently trades at 1.1770. The 61.8% retracement of the range since September comes in at 1.1746.
- The USDJPY moved to a low of 154.40. That was within a swing area target between 154.33 and 154.477. The current price is trading back higher at 154.86.
- The GBPUSD moved up to test the 61.8% retracement target of the move down from the September high at 1.34526. The high reach 1.3454. The price is back down at 1.3413 above a swing area between 1.3391 and 1.34048.
The S&P is up about 1 point. The Dow industrial average is up about 20 points while the NASDAQ is down -20 points.
Looking at the US yields, they are lower in the short and with the
- 2-year down -2.0 basis points, the
- 10 year is down -0.8 basis points while the
- 30 year is up 0.5 basis points.
