
- Prior was -2.2% (revised to -2.1%)
- Durable goods orders ex-transport 0.5% vs 0.3% expected
- Prior 0.1%
- Durable goods ex-defense 6.6% vs -1.5% prior (revised to -1.3%)
- Non-defense capital goods ex-air 0.7% vs 0.3% expected
- Prior 0.5% (revised to 0.3%)
These are very good numbers but the market reaction in the FX market was muted, although we've seen some downside in precious metals and upside in Treasury yields. The ex-air component has been positive for a fifth consecutive month underscoring the better demand environment.
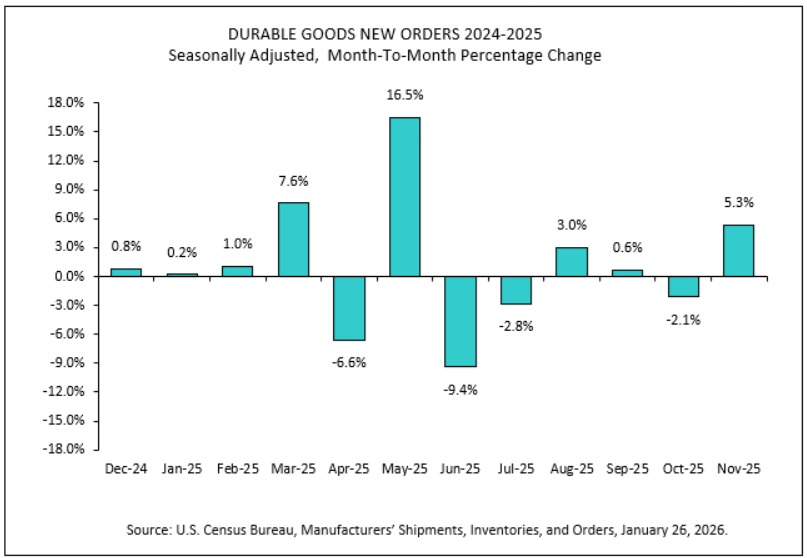
New orders for manufactured durable goods in November, up three of the last four months, increased $16.4 billion or 5.3 percent to $323.8 billion, the U.S. Census Bureau announced today. This followed a 2.1 percent October decrease. Excluding transportation, new orders increased 0.5 percent. Excluding defense, new orders increased 6.6 percent. Transportation equipment, also up three of the last four months, led the increase, $15.3 billion or 14.7 percent to $119.3 billion.
What does the US Durable Goods Orders data measure?
The US Durable Goods Orders indicator is a monthly report that tracks new orders placed with domestic manufacturers for "hard" goods, that is products designed to last three years or more.
It is widely considered a leading indicator of the economy’s health because durable goods (like washing machines, computers, and industrial machinery) are expensive, a surge in orders suggests that businesses and consumers feel confident about the future. Conversely, a drop often signals that people are tightening their belts.
It's very rarely a market-moving report because the data is volatile and often noisy. The "advance" report (released roughly 26 days after the month ends) is frequently revised a week later in the full "factory orders" report.
What’s included in the report?
The report covers a broad spectrum of products, typically categorized into:
Consumer Goods: Appliances (washers/dryers), cars, and home electronics.
Business Capital Goods: Factory machinery, computers, and power tools.
Transportation/Defense: Commercial aircraft (a massive component), ships, and military equipment.
What the markets watch?
Investors and economists don't just look at the "headline" number. They usually dig into two specific sub-metrics to get the "real" story:
Core Durable Goods (Ex-Transportation): Transportation orders, specifically from Boeing or the military, are so large and irregular that they can "noise up" the data. Stripping them out provides a clearer picture of steady demand.
Non-Defense Capital Goods (Ex-Aircraft): Often called "Core Capex," this is the most important data for many analysts. It represents pure business investment in future productivity, excluding lumpy aircraft and government spending.
