
- Prior was +16.3
Details:
- New orders 8.6 vs 11.7 prior
- Shipments 22.2 vs 0.3 prior
- Unfilled orders -4.7 vs -12.9 prior
- Delivery times 18.9 vs -9.9 prior
- Inventories 1.4 vs -0.2 prior
- Prices paid 44.7 vs 38.9 prior
- Prices received 21.2 vs 16.7 prior
- Number of employees 0.8 vs -1.3 prior
- Average employee workweek 2.8 vs -11.6 prior
Six-months from now indicators:
- 6 month index 40.0 vs 42.8 prior
- Capex index 6-month forward 25.8 vs 14.4 prior
- New orders 49.6 vs 54.1 prior
- Shipments 53.6 vs 47.4 prior
- Unfilled orders 15.3 vs 21.4 prior
- Delivery times -4.7 vs 26.1 prior
- Inventories 16.8 vs 12.4 prior
- Prices paid 53.7 vs 54.1 prior
- Prices received 38.4 vs 50.1 prior
- Number of employees 40.4 vs 14.9 prior
- Average employee workweek 24.1 vs 27.7 prior
This latest report has rebounded nicely despite the jump in energy prices.
A special question asks about Q1 production compared to Q4 2025 and 51.8% of firms report an increase and 29.6% report a decrease. However on the 'increase' side there are 25.9% of firms showing an increase of 10% or more.
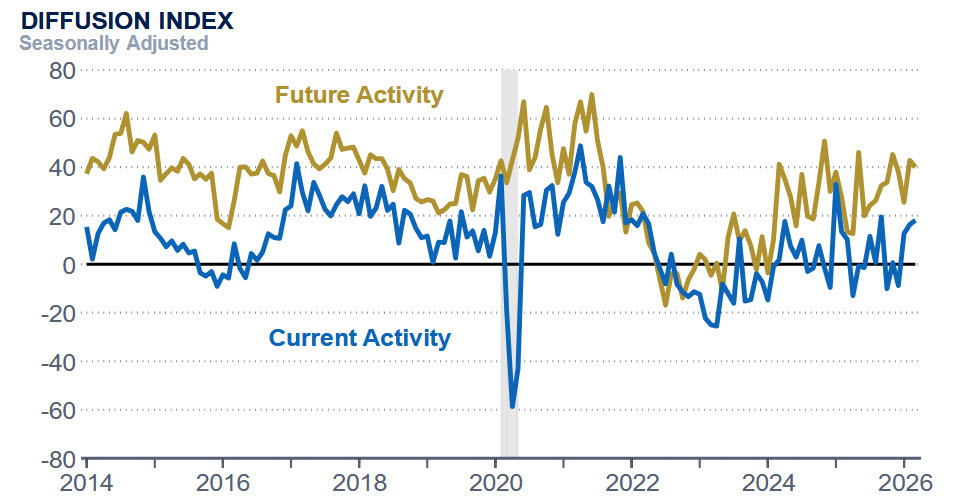
The Philadelphia Fed Manufacturing Survey, also known as the Philly Fed Index, is one of the earliest monthly indicators of manufacturing sector health in the United States. Published by the Federal Reserve Bank of Philadelphia, it surveys manufacturers in the Third Federal Reserve District, covering eastern Pennsylvania, southern New Jersey, and Delaware. Readings above zero indicate expanding activity, while readings below zero signal contraction. The survey is closely watched by economists and market participants because it often serves as a leading indicator for the national ISM Manufacturing Index released later each month.
The February data showed a notable deterioration from January across several key areas. New orders fell sharply from 14.4 to 11.7, while shipments collapsed from 9.5 to just 0.3, suggesting a significant slowdown in output. Unfilled orders worsened considerably, dropping from -4.8 to -12.9, and delivery times swung from a positive 7.3 to -9.9. On the labor front, employment flipped from a healthy 9.7 to -1.3, and workweeks plunged from 9.1 to -11.6. Price pressures eased modestly, with prices paid falling from 46.9 to 38.9 and prices received declining from 27.8 to 16.7. The forward-looking six-month index did rise from 25.5 to 42.8, offering some optimism, though capital expenditure plans dropped sharply from 30.3 to 14.4.
