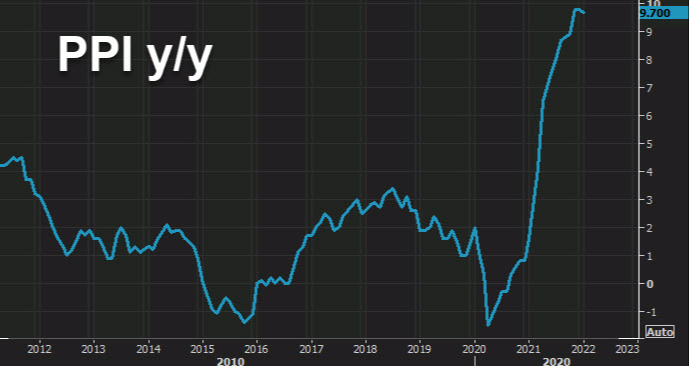
- Prior was +9.7%
- PPI m/m +1.0% vs +0.5% expected
- Prior m/m +0.3%
Core PPI:
- PPI ex food and energy y/y +8.3% vs +7.9% expected
- PPI ex food and energy m/m +0.8% vs +0.5% expected
This is another dose of hot inflation data, including on month-over-month terms, including when excluding food and energy. As this continues and spreads, it adds more and more pressure on companies to raise prices.
