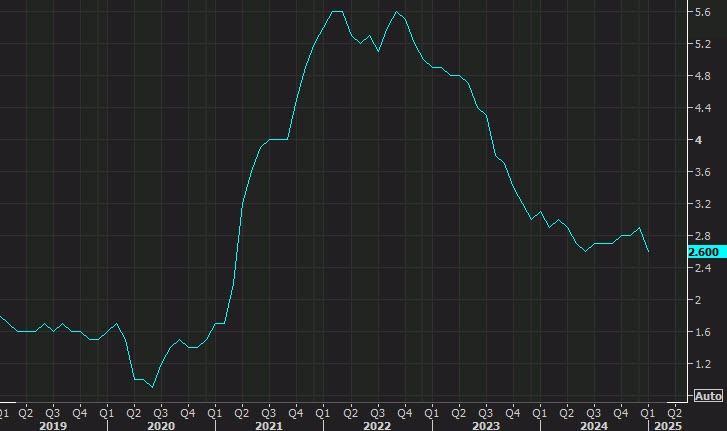
US PCE y/y
Core PCE (excluding food & energy):
- Prior was +2.8%
- Core m/m +0.3% vs +0.3% exp
- Unrounded core PCE +0.285% vs +0.156% m/m prior (unrounded exp +0.27%)
- PCE excluding food, energy and housing +0.3% m/m vs +0.2% m/m prior
- Supercore (services ex-shelter) +0.2% m/m and +3.1% y/y (lowest since Feb 2021)
Headline PCE
- Headline PCE +2.5% y/y vs +2.5% expected
- Deflator +0.3% m/m vs +0.3% expected
- Unrounded headline +0.325% vs +0.2557% m/m prior (unrounded exp +0.31%)
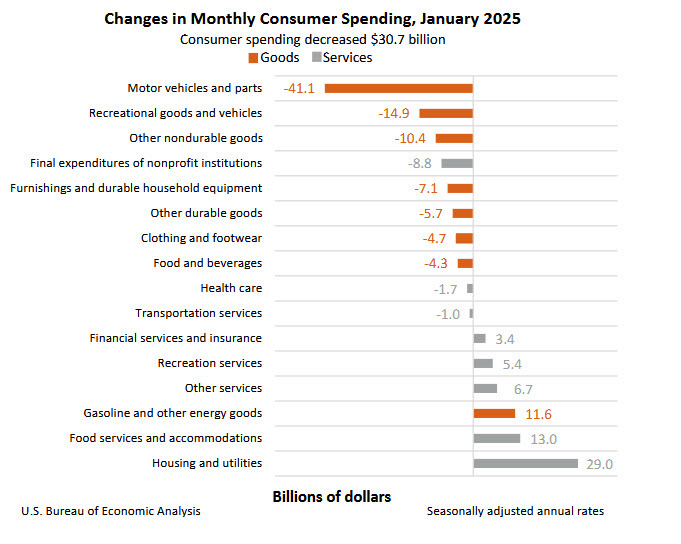
Consumer spending and income for January:
- Personal income +0.9% vs +0.3% expected. Prior month +0.4%
- Personal spending -0.2% vs +0.1% expected. Prior month +0.7%(revised to +0.8%)
- Real personal spending -0.5% vs +0.4% prior (revised to +0.5%)
- Savings rate 4.6% vs 3.8% prior
These numbers are largely in-line unless you want to split hairs on the unrounded figures. There is some USD selling in the aftermath as it cools fears of a hot number. If you zoom out, core is starting to show an improving trend again.
The other thing that stands out is a nice jump in incomes.
Meanwhile, spending on vehicles took a dive, like due to bad weather. The good news is that should rebound just as strongly whenever it warms up.