
- Prior 1.4%
- House price M/M +0.2% vs +0.3% expected
- Prior +0.5%
House price data from the FHFA:
- Prices +1.6% y/y vs +1.8% prior (revised to +1.9%)
- Prices +0.1% m/m vs +0.1% prior
The US housing market remains weak and on continuing deceleration. This is January data, so things might have deteriorated much further after the US-Iran war broke out. Mortgage rates have risen substantially due to inflation fears and a much less dovish Fed.
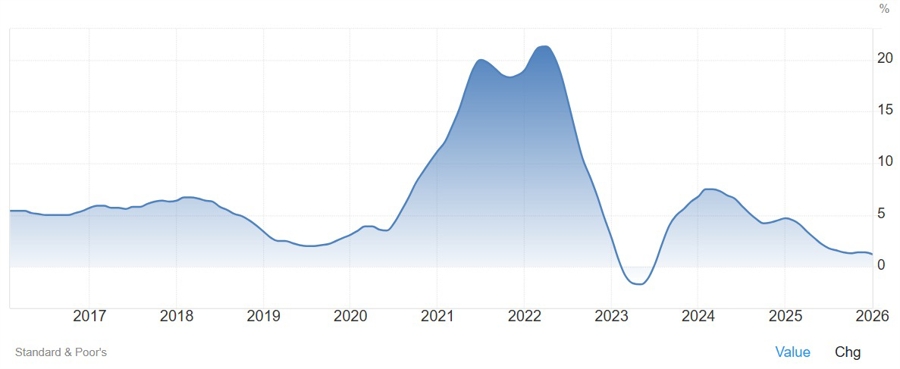
What is the Case-Shiller Index:
The Case-Shiller Home Price Index is the leading measure of U.S. residential real estate prices. It tracks the changes in the value of residential real estate by monitoring the purchase price of the same single-family homes over time.
Developed in the 1980s by economists Karl Case and Robert Shiller, it is widely considered the "gold standard" for understanding housing market trends because it avoids the distortions found in "average" or "median" price reports.


