
- Prior week 213K
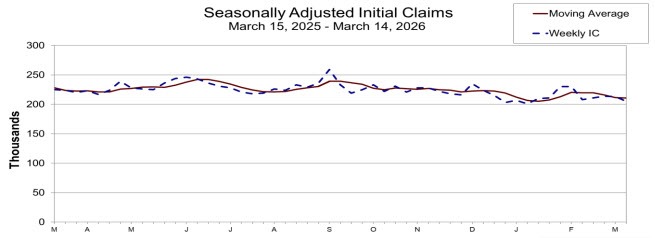
- Initial jobs claims 205K vs 215K estimate
- 4 week moving average of initial jobless claims 210.75K versus 211.50K last week.
- Continuing claims 1.857M vs 1.850M estimate. Prior week 1.850M
- 4 week moving average of continuing claims 1.850M versus 1.852M last week
- The largest increases in initial claims for the week ending March 7 were in Missouri (+3,907), Virginia (+1,670), Pennsylvania (+1,292), California (+911), and Massachusetts (+779),
- The largest decreases were in New York (-14,567), Michigan (-2,549), New Jersey (-616), Connecticut (-471), and Vermont (-468).
The dominant theme is a "low-hire, low-fire" . The data reflects stability in the labor market amid a low-firing backdrop combined with slowing hiring.
Low claims don't mean the labor market is entirely healthy. Hiring can slow at the same time layoffs remain low, creating a market where people who have jobs keep them but people looking for work struggle to find new opportunities. Looking at the JOLTs job openings, they have declined from 7980K to 6946K more recently. Hires have similarly seen a decline.
.
JOLTS: Job Openings vs. Hires (Last 12 Months)
All levels are in thousands, seasonally adjusted.
| Month | Job Openings (Level) | Hires (Level) |
| Jan 2026 (p) | 6,946 | 5,295 |
| Dec 2025 | 6,550 | 5,272 |
| Nov 2025 | 6,846 | 5,121 |
| Oct 2025 | 7,170 | 5,304 |
| Sep 2025 | 7,169 | 5,350 |
| Aug 2025 | 7,227 | 5,410 |
| Jul 2025 | 7,181 | 5,390 |
| Jun 2025 | 7,437 | 5,420 |
| May 2025 | 7,769 | 5,480 |
| Apr 2025 | 7,820 | 5,510 |
| Mar 2025 | 7,950 | 5,620 |
| Feb 2025 | 7,980 | 5,740 |
(p) = Preliminary data
Key Takeaways from the Data:
The 2025 Slump: You can see a steady decline in both openings and hiring through 2025. Job openings reached a multi-year low in December 2025 (6.55 million) before showing signs of life again in January.
Hire-to-Opening Ratio: Throughout the year, job openings significantly outnumbered actual hires, though the gap narrowed as the labor market "cooled."
Sector Shifts: The recent January 2026 bump was driven largely by Finance and Insurance and Healthcare, while sectors like transportation and warehousing saw a decrease in hiring activity.
REVISION TO SEASONAL ADJUSTMENT FACTORS Note: This week's release reflects the annual revision to the weekly unemployment claims seasonal adjustment factors. The seasonal adjustment factors used for the UI Weekly Claims data from 2021 forward, along with the resulting seasonally adjusted values for initial claims and continuing claims, have been revised. For more information regarding the seasonal adjustment methodology, please see the additional information at the end of this news release.
Initial jobless claims are a weekly U.S. Department of Labor report measuring new filings for unemployment benefits, serving as a leading indicator of economic health. the report is released on Thursdays, this data helps analysts track real-time labor market trends and forecast employment rates.
