The BLS released the GDP for the 3Q and it showed strong growth but higher inflation:
- Preliminary GDP for Q3 4.3% vs 3.3% estimate
- Sales 4.6% vs 7.5% last quarter
- Deflator 3.7% vs 2.7% estimate. Prior 2.1%
- Core PCE 2.9% vs 2.9% estimate. Prior 2.6%
- Consumer spending 3.5% vs 2.5% prior
For the full report: CLICK HERE.
Decoding the Q3 2025 GDP Growth
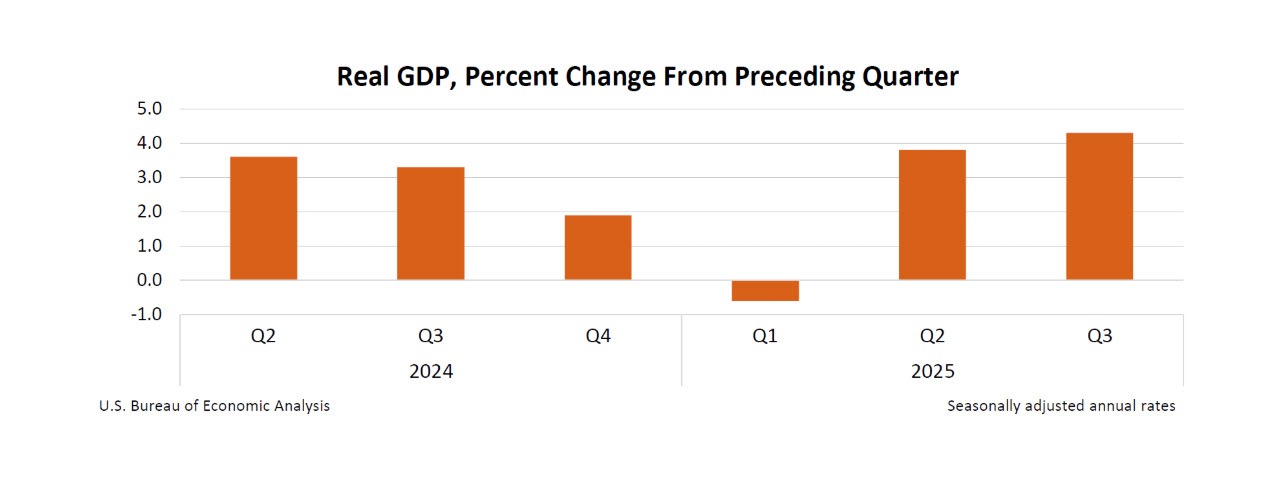
The latest data from the U.S. Bureau of Economic Analysis (BEA) reveals that the American economy expanded at a robust 4.3% annualized rate during the third quarter of 2025. This performance exceeded most market expectations, which had centered around a 3.3% expansion.
Based on the provided chart, here is the breakdown of the key contributors to this growth:
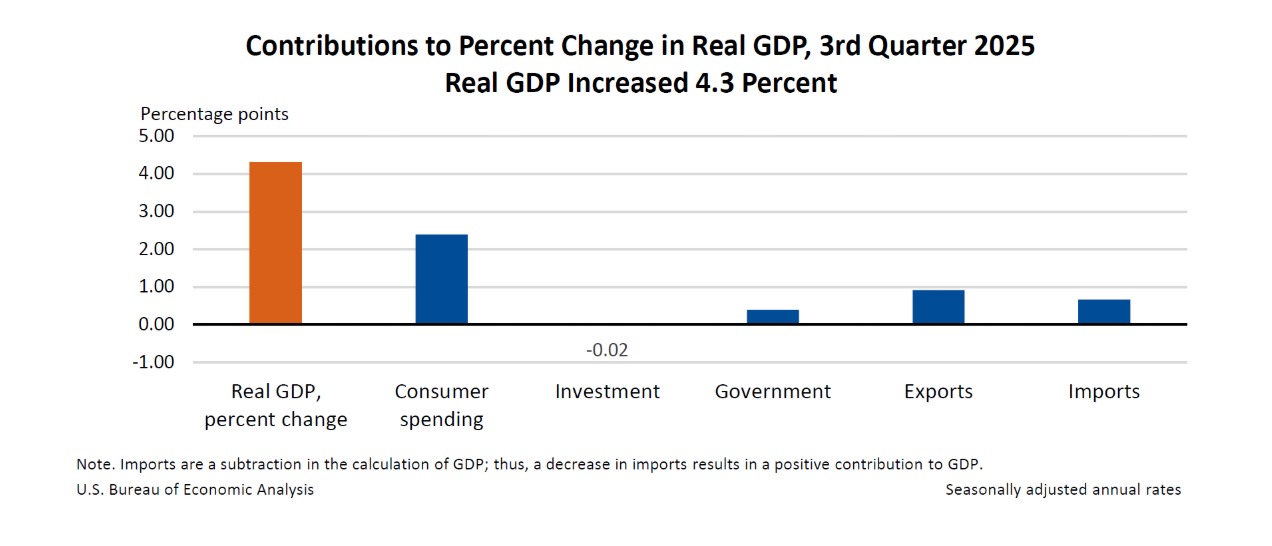
The Primary Drivers of Growth
Consumer Spending (The Engine): Household spending remains the primary catalyst for the economy, contributing +2.40 percentage points to the overall GDP figure. This reflects continued resilience in private consumption despite earlier concerns of a slowdown.
Exports (Global Demand): Strong international demand for American products and services added +0.90 percentage points to the growth rate.
Imports (Calculation Quirk): According to the BEA, imports are a subtraction in the GDP formula. A decrease in imports resulted in a +0.65 percentage point positive contribution to the final figure.
Government Spending: Public sector expenditures provided a modest tailwind, contributing +0.40 percentage points to the quarterly expansion.
The Sole Headwind
Investment: Private domestic investment was the only negative contributor in the chart, shaving -0.02 percentage points off the total. This suggests a slight caution among businesses regarding capital expenditures or residential housing activity during the quarter.
The Bottom Line
With a 4.3% growth rate, the U.S. economy remains significantly stronger than many global peers. While some volatility remains due to shifting trade patterns and labor market updates, the dominance of consumer spending indicates that the domestic economic core remains remarkably firm as we head into the final months of the year.
Summary Table: Q2 vs. Q3 Growth Contributions
| Component | Q2 2025 (Final) | Q3 2025 (Current) | Trend |
| Real GDP (Annualized) | 3.8% | 4.3% | 📈 Accelerating |
| Consumer Spending | +1.7 pp | +2.4 pp | 📈 Strengthening |
| Investment | -3.4 pp (Inventories) | -0.02 pp | 📉 Stabilizing |
| Government | 0.0 pp | +0.4 pp | 📈 Rebounding |
| Net Trade (Exp + Imp) | +4.8 pp | +1.55 pp | 📉 Normalizing |
Atlanta Fed GDPNow: Final Q3 2025 Summary
The Atlanta Fed GDPNow model showed a final reading of 3.5% lower than the 4.3% from the actual data. The data showed a lower contribution from consumer spending of 1.84% vs 2.4% .
Headline Growth Estimate
Final Estimate: Real GDP growth is projected at 3.5 percent (seasonally adjusted annual rate).
Recent Trend: This represents a slight downward revision from the 3.6 percent estimate recorded on December 11.
Context: The estimate peaked at 4.2 percent in late November before cooling off through December.
Key Internal Drivers
The December 16 update incorporated new data from the US Census Bureau and the US Bureau of Labor Statistics, leading to minor adjustments in the growth components:
Consumer Spending: Contribution to real GDP growth fell slightly to 1.84 percentage points.
Inventory Investment: Contribution was also adjusted downward, falling to 0.09 percentage points.
Market Reaction:
The USD has moved higher after the report but the moves are just taking back some of the declines seen earlier in holiday trading.
EURUSD: The EURUSD tested the highs from December at 1.18037 with a high at 1.1801. That is up from the closing level yesterday at 1.1761. The low has reached 1.1772 so far.
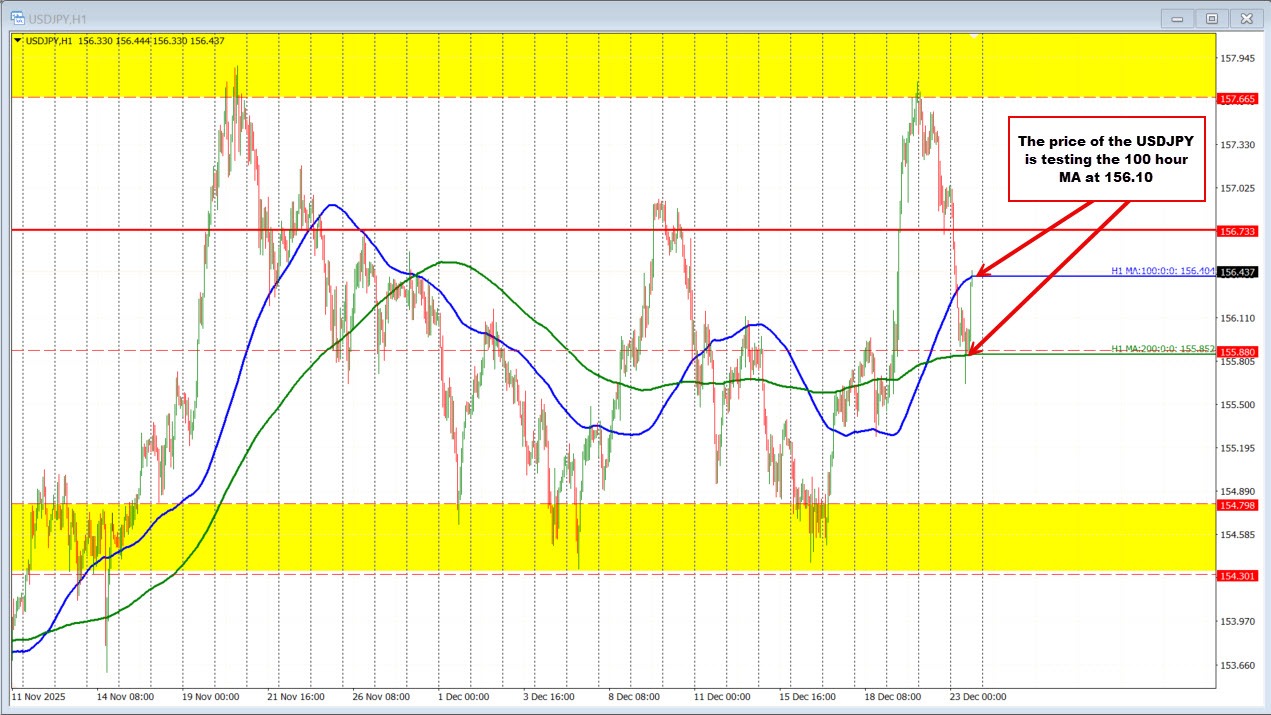
USDJPY: The USDJPY fell from a closing level at 157.026 to a low prior to the report at 155.64. The price has rebounded to 156.44 which is just above the 100 hour MA at 156.40.