
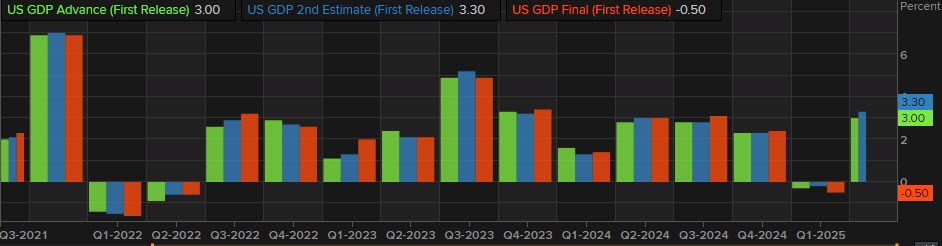
- Prior estimate 3.0%
- GDP 2nd revision 3.3% vs 3.1% estimate
- Sales Preliminary Q2 6.8% vs 6.3% last
- Consumer spending Prel. 1.6% vs 1.4% last
- GDP deflator 2.0% vs 2.0% estimate. Last 2.0%
- Core PCE Prices prelim. 2.5% vs 2.6% est. Last 2.5%
- PCE prices preliminary 2.0% vs 2.1% preliminary
- PCE ex food and energy housing 2.2% versus 2.2% preliminary
- PCE Services ex energy and housing 2.1% vs 2.3%
Contributors to the 3.3% growth:
- Consumer spending +1.07%
- Investment -2.70%
- Government -0.03%
- Net trade +4.95%
How did the 2nd quarter compare to the 1st quarter?
- Consumer spending +0.31%.
- Investment +3.9%.
- Government +0.10%.
- Net trade -4.61%
The declines in the components in the Q1 were gains in Q2 with tariff impact evident. Inventories, a key part of investment showed a gain of 2.59% in the 1st quarter as companies increased imports, while inventories declined -3.29% in the 2nd quarter.
In the 1st quarter imports contributed a negative -4.66% to GDP (imports are a negative contribution to US GDP). In the 2nd quarter imports added 5.09% as the import surge declined.
The data is old news better and quarter data makes the start point for the current quarter a higher level.
US stocks are marginally higher:
- Dow industrial average up 80 points
- S&P up 3.35
- NASDAQ index up 3.15%
