
- Prior was -0.5%
- Wholesale sales +2.7% vs +0.4% expected
- Prior sales +1.1% vs +0.5% initially reported
This number is a big boost for Q1 GDP trackers and likely indicates a response to the Supreme Court halting tariffs. That positive GDP from inventories -- in that case -- could be unwound by higher imports in the month.
In today's release covering February 2026, wholesale sales came in at $751.9 billion, representing a 2.7% increase from January and an 8.8% gain year-over-year. Total inventories stood at $919.6 billion, up 0.8% from the prior month and 1.8% above February 2025 levels. The inventories-to-sales ratio fell to 1.22, down notably from 1.31 a year earlier, suggesting that sales growth has been outpacing inventory accumulation. Durable goods were a particular source of strength, with sales rising 4.1% month-over-month, led by the electrical goods subsector, which surged 8.3%.
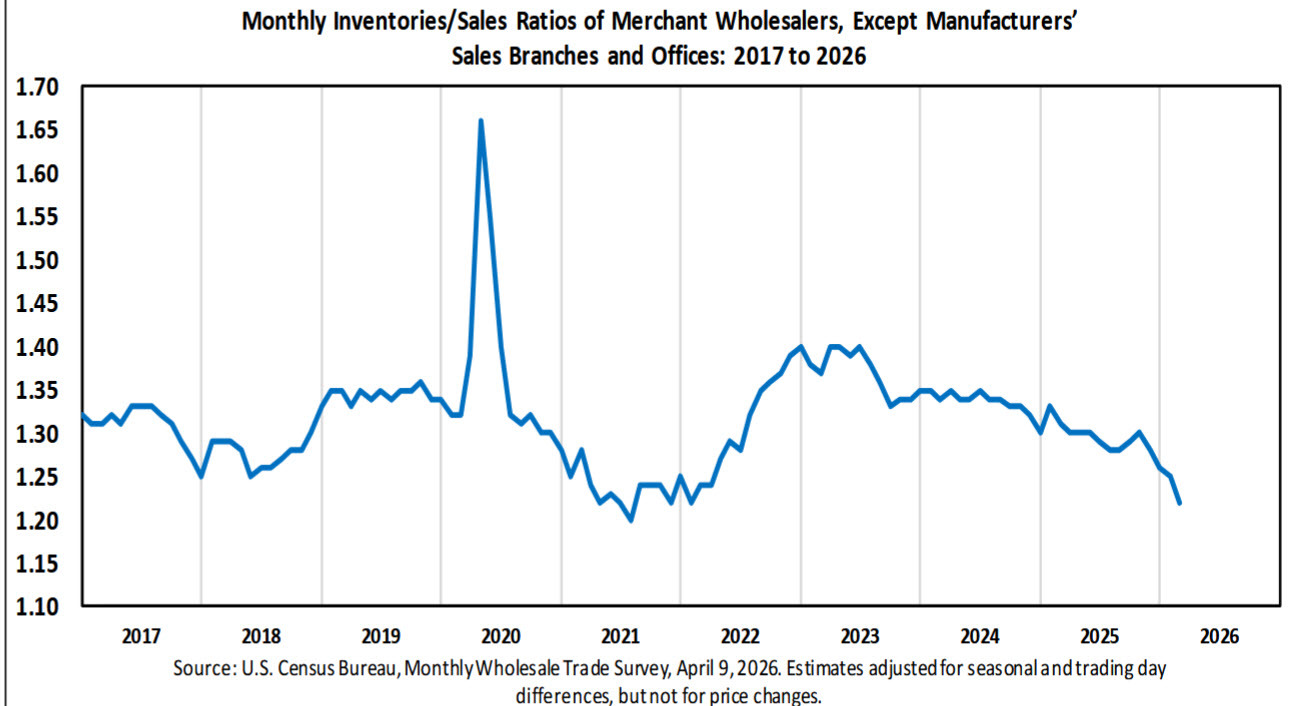
The Monthly Wholesale Trade Survey , conducted by the U.S. Census Bureau, is one of the government's key economic indicators, tracking sales, end-of-month inventories, and inventories-to-sales ratios for merchant wholesalers across the country. The survey excludes manufacturers' sales branches and offices, as well as wholesale electronic markets, agents, and brokers. Each month, the Census Bureau surveys a probability sample of approximately 4,200 employer firms, stratified by industry and sales size, with estimates adjusted for seasonal variation and trading day differences but not for price changes.
The wholesale sector serves as a critical intermediary in the U.S. supply chain, connecting manufacturers and producers with retailers and other businesses. Because wholesalers sit between production and final sale, their sales and inventory levels offer valuable signals about the direction of broader economic activity — rising inventories relative to sales can suggest slowing demand, while falling ratios may indicate strengthening conditions.


