
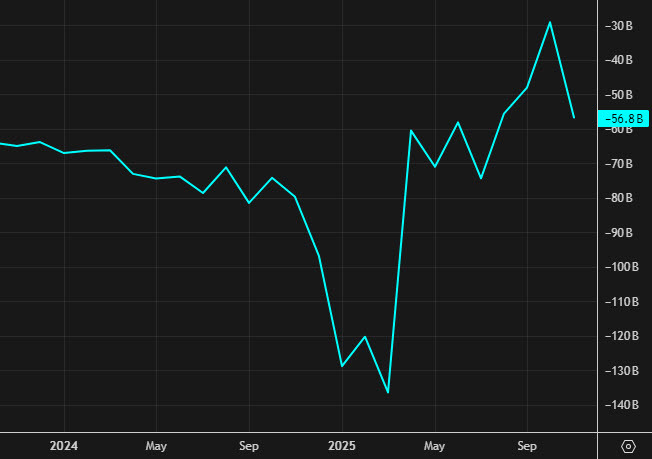
- Prior was -56.8B
- Goods trade balance -86.04B
This is a big part of tomorrow's GDP release and we will see updated trackers later today.
Due to the recent lapse in federal funding, both the Advance Economic Indicators Report (which includes the advance goods trade balance, originally scheduled for January 28) and the full U.S. International Trade in Goods and Services report for December (originally scheduled for February 5) were rescheduled to release simultaneously on February 19, 2026.
The U.S. trade picture in late 2025 was marked by dramatic month-to-month swings, driven by tariff effects, volatile gold and pharmaceutical shipments, and shifting import patterns as businesses adapted to the evolving trade policy landscape.
In September, the goods and services deficit came in at $52.8 billion, narrowing $6.4 billion from a revised $59.3 billion in August. The improvement reflected continued adjustment to the IEEPA tariffs that went into effect in August, as the initial front-loading of imports earlier in the year began to unwind.
October produced a striking improvement, with the total deficit plunging to $29.4 billion (later revised to $29.2 billion) — down $18.8 billion from September and the lowest level in roughly two decades. Exports surged $7.8 billion to $302.0 billion, driven by a $10.2 billion jump in industrial supplies and materials exports, including a $6.8 billion increase in nonmonetary gold and a $3.6 billion rise in other precious metals. Imports fell $11.0 billion to $331.4 billion. The goods deficit shrank to $59.1 billion, while the services surplus ticked down slightly to $29.8 billion. Capital Economics attributed the dramatic narrowing largely to swings in gold and pharmaceutical trade rather than a structural shift, though higher computer imports pointed to genuine demand strength tied to the AI buildout. The goods deficit with China continued shrinking to record lows, while tariffs were visibly compressing deficits with the EU and Canada. Year-to-date through October, the goods and services deficit was still up 7.7% from the same period in 2024, reflecting the massive import surge in Q1 ahead of tariff announcements.
November saw a sharp reversal, with the deficit nearly doubling to $56.8 billion — up $27.6 billion from the revised October figure. Exports fell $10.9 billion to $292.1 billion, while imports jumped $16.8 billion to $348.9 billion. The goods deficit widened $27.9 billion to $86.9 billion, while the services surplus ticked up $0.3 billion to $30.1 billion. Notably, November imports of capital goods reached a record $101.8 billion, and imports of "other goods" also hit a record $13.9 billion. Exports to Taiwan reached a record $5.3 billion. On a year-to-date basis through November, the total deficit was up $32.9 billion (4.1%) from the same period in 2024, with exports up 6.3% and imports up 5.8%. Over the trailing 12 months through November, the U.S. ran a total trade deficit of $936.5 billion — a goods deficit of $1.27 trillion partially offset by a services surplus of $335.8 billion. The largest goods deficits by country were with China ($214.6 billion), Mexico ($197.4 billion), and Vietnam, while top exports by value were civilian aircraft, pharmaceutical preparations, and crude oil.
The US also released wholesale inventories for December:
- Inventories +0.2% vs +0.2% prior
- Retail inventories ex autos +0.2% vs +0.2% exp
- Prior retail inventories +0.2% (revised to -0.2%)
The inventories numbers are also a big part of the GDP release but the report is in-line with expectations so it shouldn't cause too many waves.


