
Pending home sales
- Pending home sales -9.3% vs +0.4% expected
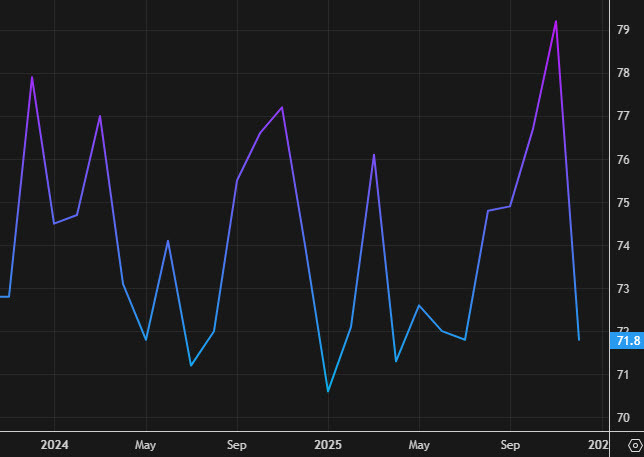
- The index 71.8 vs 79.2 prior
- All regions saw drops with the Midwest as the laggard
- US October construction spending +0.5% vs +0.1% expected
- Prior was +0.2%
That is a sharp drop in pending home sales and it won't get any better in January with US 30-year rates now at the highest since September. Looking at the index, it's back down to July levels.
On the upside, the construction spending report should lead to a tick higher in US Q4 GDP estimates.
Overall, year-to-date construction spending through the first ten months of the year totaled $1,825.3 billion, down 1.4% compared to the same period in 2024. You'd hate to see where it would be without massive AI-related spending.
The standout weakness remains in manufacturing construction, which dropped 9.6% Y/Y - a red flag for industrial capex. This sector has been sliding for months and shows no signs of stabilizing and rising long-term borrowing rates won't help.
On the positive side, residential construction posted a decent 1.3% monthly gain, suggesting housing activity isn't completely dead despite elevated mortgage rates. Power construction (+3.3% Y/Y) and sewage/waste disposal (+15.8% Y/Y) continue to show strength, likely driven by infrastructure spending.
