- Prior was +3.3%
- Prices m/m -0.1% vs +0.3% expected (prior was +0.9%)
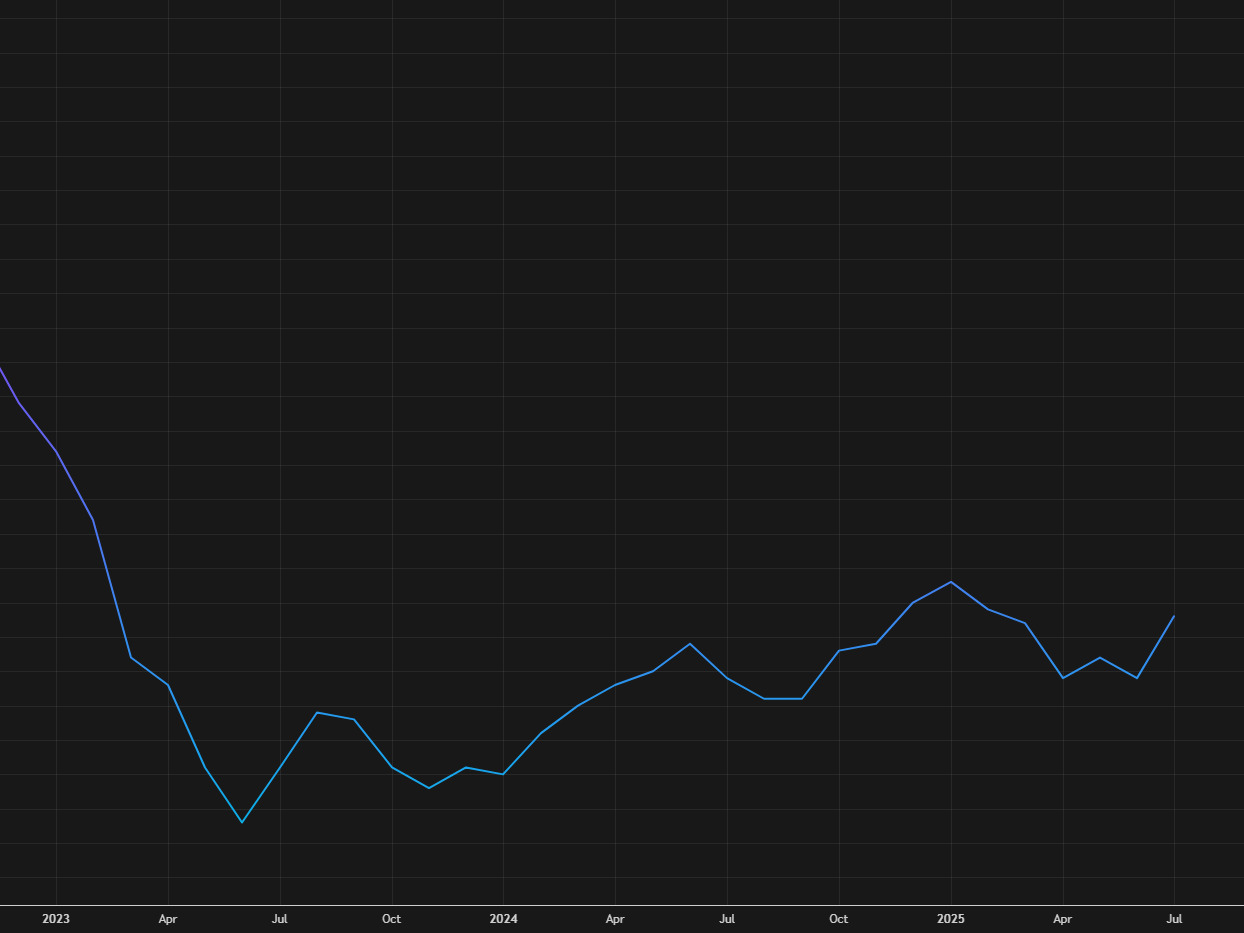
- PPI ex-food and energy +2.8% vs +3.5% expected (prior was +3.7%)
- ex-food and energy m/m -0.1% vs +0.3% expected (prior was +0.9%)
- Ex-food, energy and trade +2.8% y/y vs +2.8% prior
- Ex-food, energy and trade 0.3% m/m vs +0.6% prior
Tomorrow the CPI report is due. This is a great sign that an undershoot could be coming and US equity futures have jumped. If we get a lower reading that expected on CPI -- especially a miss this large -- a 50 bps cut is more likely.
The sequential drop in PPI ex-food and energy was the largest in the last 10 years.


