Some much for the catch-up trade.
The Russell 2000 is down 2% today and at the lowest levels of the month. Rising Treasury yields and dwindling hopes for 75 bps of Fed cuts this year are behind the selling of smaller-cap US stocks.
Technically, the index is being sold heavily after a head-and-shoulders pattern formed on the hourly chart.
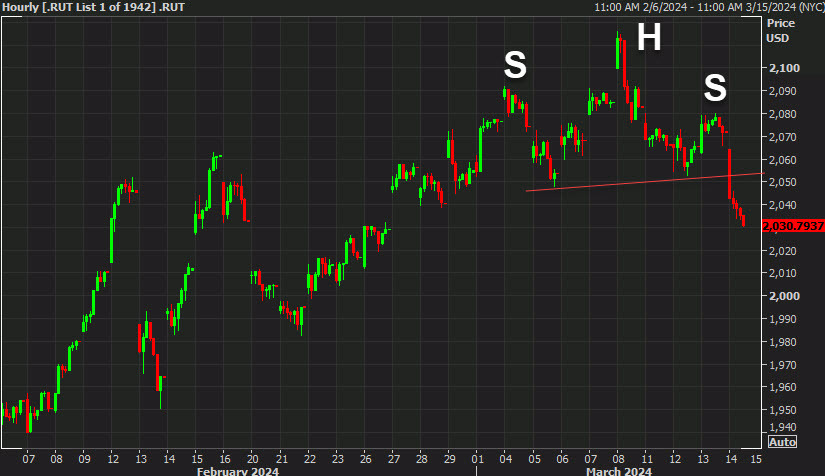
The measured target of the move is 1985, which is another 2.2% lower from here.
The largest weight of the index is Supermicro and it's struggling today with a 4.8% decline on a broader pullback in high-flying AI stocks. US banks are also a major weighting in the Russell 2000 and the KRE regional banking ETF is down 2.25% to a nine-day low.
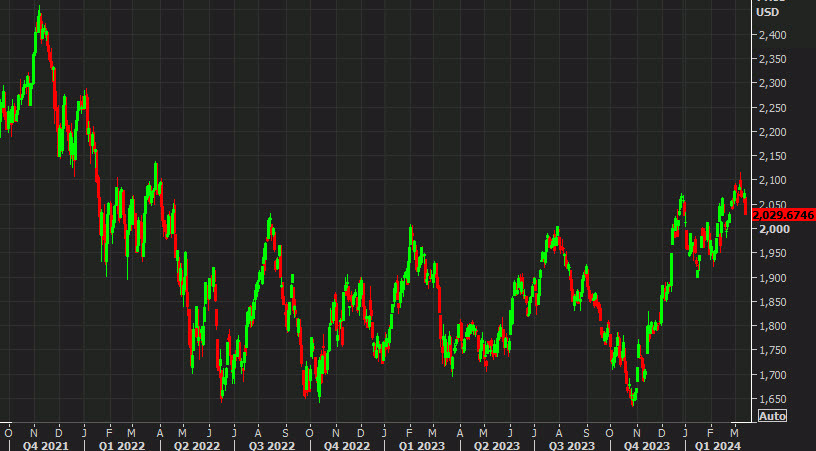
Zooming out on the chart, the Russell had looked like it was breaking higher after more than a year of consolidation and several failed breaks of 2000. However now that's in question if the bulls can't shore up support.