
NQ analysis: order flow points to a bullish repair, but not a runaway breakout
Nasdaq price prediction today leans bullish, with a market bias score of +5.8 at investingLive.co, as order flow improves and the Point of Control shifts higher. The recovery looks real, but this still needs to prove it can turn into a lasting trend rather than just a sharp repair move.
The financial markets are currently humming with a renewed sense of optimism, offering a melodic blend of recovery and high-tech ambition. Investors are finding a rhythmic beat in the recent US major indices closing higher, a move fueled significantly by a resurgence in small-cap stocks that suggests a broadening of market breadth. This upward swing is harmonizing perfectly with major corporate milestones, such as the Amazon stock rebound driven by a robust AWS growth narrative. For those scanning the horizon for a definitive "go" signal, the air is thick with anticipation as Barclays flags the strongest buy signal in over a year, suggesting that the recent sentiment reset has cleared the stage for a potential sustained rally.
Beyond the traditional equity theater, the Artificial Intelligence and digital asset sectors are providing some of the most compelling solos of the season. The hardware backbone of the AI revolution received a major boost with news that China approved Nvidia H200 sales, easing geopolitical friction and opening new revenue channels for the semiconductor giant. Simultaneously, the crypto landscape is adding its own upbeat tempo to the mix; while Bitcoin stabilizes at impressive levels, Ethereum is leading a crypto rally that has analysts revising their forecasts upward. Whether you are tracking silicon or satoshis, the current market composition suggests a period of vibrant activity where technology and renewed investor confidence are playing in perfect sync.
What you need to know is that Nasdaq futures are starting to tell a more encouraging story.
After an earlier period of weakness, the market is no longer behaving like a clean downside continuation. Instead, recent trading points to a bullish repair phase, where buyers are gradually reclaiming lost ground and defending higher levels with improving quality. For traders looking for Nasdaq analysis today, that is an important distinction. This is not yet a full breakout environment, but it is also no longer the kind of structure that invites aggressive bearish confidence.
That puts the market in an interesting spot. The tone has improved, the internal behavior has improved, and the path higher remains open, but only if buyers continue to hold the key zones that now matter most.
Nasdaq price prediction today: why the bias is bullish, but not extreme
The current market bias score is +5.8, which points to a moderately bullish outlook.
That score reflects a market where buyers have clearly improved the structure, but not one that has fully graduated into a high-conviction momentum trend. In other words, this is a bullish read with discipline. The evidence is good enough to respect, but not so one-sided that traders and investors should treat it as a guaranteed upside runaway.
The best way to describe the current setup is this: Nasdaq futures are showing a healthier recovery profile, and that recovery has enough substance to matter.
Why this Nasdaq move looks healthier than a simple bounce
One of the most constructive parts of the recent Nasdaq futures behavior is that pullbacks have not done as much damage as bears would normally want to see. When a market rallies and then gives back only limited ground, that often suggests selling pressure is being absorbed rather than fully taking control.
That is what makes this stock market analysis more interesting than a headline-driven rebound.
The medium-term structure has been the strongest piece of the puzzle. It shows that the market has not only bounced, but has also started to do more business at higher prices. That matters because real trend repair is not just about price ticking up. It is about whether the market begins to accept those higher levels as fair value.
What Point of Control means, and why traders should care
A useful concept here is the Point of Control, often shortened to POC.
For newer traders and investors, the Point of Control is the price level where the most trading activity took place over a given period. You can think of it as the market's busiest zone, or the area where buyers and sellers did the most business. Because of that, it often acts as a reference point for value.
Why does this matter?
If the Point of Control starts shifting higher over time, it usually means the market is becoming more comfortable doing business at higher prices. That is often a constructive signal. If it shifts lower, it can suggest weakening demand and lower value acceptance.
In the recent Nasdaq futures structure, the medium-term Point of Control climbed from roughly 24,513 to 25,013. On the shorter-term view, it also pushed higher from about 24,988 to 25,138. That is important because it suggests the market is not only bouncing, but is also relocating value upward.
For traders, that can be a clue that buyers are gaining traction. For investors, it can help distinguish a healthy repair phase from a weak rebound that lacks real sponsorship.
A simple order flow explanation for traders and investors
Order flow is another term that sounds technical, but the core idea is straightforward.
Order flow looks at how buying and selling pressure actually enters the market. Instead of focusing only on where price closes, it asks a deeper question: were buyers truly pressing the market higher, or did price rise without much real commitment? On the other side, were sellers genuinely in control, or did a pullback fail to attract strong downside pressure?
This is why order flow can be so useful in Nasdaq analysis and price prediction.
A market can rise on the chart and still look weak internally if the buying is thin and vulnerable. A market can also pull back and still look healthy if selling pressure fails to create real damage. That second case is closer to what we are seeing now. The recent evidence suggests that downside attempts have not produced the kind of follow-through that would normally confirm a fresh bearish phase.
That does not mean the market must go higher. It means the underlying battle currently looks better for buyers than it did earlier.
The Nasdaq "Reclaim": Why the Bulls are Moving Back In
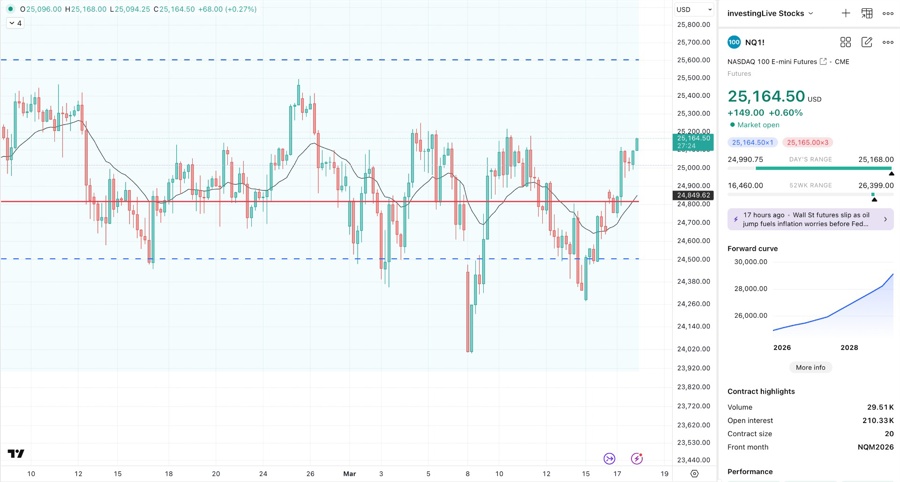
If the Nasdaq was a house party, last week felt like the neighbors called the cops and everyone scrambled for the exits. But as of this morning, March 18, 2026, the music is back on, and the vibe has shifted from "panic" to "profit."
Looking at the hourly chart, we’re seeing a classic technical "reclaim." After that temporary dip into the basement (down toward the 24,000 level), price action has fought its way back into the Value Area—that sweet spot where the market actually agrees on a fair price.
But it’s not just a lucky bounce; there’s some serious structural muscle backing this move.
The "Double Floor" Defense
The most encouraging sign for anyone wearing a "Bull" hat right now is the confluence of support sitting right beneath us. We’ve managed to climb above two massive psychological and technical hurdles:
The Point of Control (POC): Resting at 24,820, this is the "center of gravity" where the most trading volume has occurred. Being above this level means the "average" buyer is currently in the green, which usually keeps the panic-selling at bay.
The 4-Hour EMA 20: This "moving floor" is currently sitting around 24,850. When you see the price hovering comfortably above this line, it tells you the medium-term trend has officially shaken off the cobwebs.
The Verdict: Bullish Til Proven Otherwise
By staying above that 24,820–24,850 zone, the Nasdaq is essentially telling us it has rejected the lower prices. We’ve moved past mere "acceptance" and into a push for higher ground.
As long as we hold above that red pivot line on the chart, the path of least resistance is looking decidedly upward. The bears had their shot during the recent dip, but for now, they’ve been locked out of the room. The next stop? Testing those recent highs near 25,480
The Bear Case: What if the "Launchpad" Fails?
While the current chart looks like a bull's dream, seasoned traders know that the Nasdaq loves a good "fake-out." If the music stops, it’ll likely be because of the heavy-hitting fundamental risks looming over today's session.
Here is what the "Bear Scenario" looks like for the remainder of March 2026:
The "Hawkish Hold" Trap
Today is FOMC Wednesday, and the Federal Reserve is the ultimate wildcard. While the market expects rates to stay steady, the danger lies in the "Dot Plot" and Chair Powell’s tone.
The Risk: If the Fed signals that the one expected rate cut for 2026 is being pushed to 2027 due to sticky inflation (currently near 3%), the "bullish reclaim" we see on your chart could evaporate in minutes.
The Trigger: Watch the 24,820 Point of Control. If a post-Fed candle closes decisively below this level, the "fair value" we just reclaimed becomes "overhead resistance."
The "Oil & Iran" Squeeze
The news snippet in your screenshot mentions oil jumps fueling inflation worries. With Brent crude hovering near $100 due to the ongoing conflict in the Middle East and disruptions in the Strait of Hormuz, tech stocks are feeling the heat.
The Margin Crunch: High energy prices act as a hidden tax on Big Tech’s massive data centers and global supply chains.
The Technical Fall: If geopolitical tensions spike further today, we could see a "failed breakout." This happens when the price pokes above the current levels only to get slammed back down, trapping everyone who bought the "reclaim."
The Nightmare Level: 24,000
If the bears take back control of the 4-hour EMA 20 (24,850), the next stop isn't a gentle slide—it’s a trip back to the recent lows.
Losing the 24,820–24,850 support zone opens the door for a rapid descent toward the 24,200 mark.
A break below 24,000 would officially shift the narrative from a "healthy pullback" to a "structural breakdown."
The Bottom Line: The bulls have the ball, but they’re playing on a very slippery field today. Keep a tight stop-loss just below that 24,820 POC to protect your capital if the Fed decides to rain on the parade
So what are the key Nasdaq price levels that matter now?
When I'm looking at this consolidated pircure, for me, the most important line in this setup is 25,013.
As long as Nasdaq futures continue to hold around or above that area, the bullish repair story remains alive. That level now acts as a key decision point between a healthy reclaim and a failed rebound.
Above that, the immediate short-term support shelf sits around 25,113 to 25,138. If the market keeps holding that zone, it reinforces the idea that buyers are still comfortable supporting price at higher levels.
If Nasdaq futures start slipping back and holding below 25,013, the tone changes. At that point, the current setup begins to look less like a constructive repair and more like a failed reclaim attempt.
What traders should watch next
For active traders, the next move is less about predicting a headline and more about watching whether the market can keep defending the newly established support areas.
If price holds above 25,013 and continues to stabilize above the 25,113 to 25,138 zone, the bullish case stays in place and higher probing remains the more likely path.
If price breaks back below 25,013 and starts spending time there, the structure weakens. That would suggest the recent repair was not strong enough to stick.
This is also where patience matters. A lot of traders lose edge by reacting too fast to every push and pull. In a repair phase like this, what matters most is whether higher value can be maintained, not just briefly touched.
Why long term investors (and not only traders) should care too
Even longer-term investors can learn something from this kind of market read.
Order flow and Point of Control analysis are not just tools for day traders staring at every candle. They can also help investors understand whether a rebound in a major index like the Nasdaq has real participation behind it. When the market starts accepting higher prices and pullbacks fail to generate heavy damage, that can be an early sign that broader risk appetite is improving.
It does not replace fundamentals, macro analysis, or earnings trends. But it adds another layer of evidence. It helps answer a practical question: is this move gaining support under the surface, or is it still fragile?
Right now, the answer leans constructive.
Nasdaq outlook: bullish repair is alive, but buyers still need to prove it
The current Nasdaq setup deserves respect from the bullish side, but not blind optimism.
This is a healthier market than it was earlier, and the improvement looks meaningful. Higher-value acceptance, better support behavior, and a rising Point of Control all support the case for a continued recovery. At the same time, this still looks more like a bullish repair phase than a full, mature breakout trend.
That is why the +5.8 bias score makes sense. It captures a real upside lean without overstating the case.
For now, the bullish structure remains favored while 25,013 holds. If buyers keep defending that area, Nasdaq futures have room to extend higher. If that level fails, the tone shifts quickly and the recovery case loses quality.
This article is for educational and decision-support purposes only. It is not financial advice. All trading and investing involve risk.
