Federal Reserve
The headline is the median dot falling further than expected, putting a full 50 bps of easing into the curve rather than the 25 bps expected. In addition, there are five dots below that.
- Fed funds rate left unchanged at 5.25-5.50%, as expected
- Recent indicators suggest that growth of economic activity has slowed from its strong pace in the third quarter
- Job gains have moderated since earlier in the year but remain strong, and the unemployment rate has remained low
- Tighter financial and credit conditions for households and businesses are likely to weigh on economic activity, hiring, and inflation. The extent of these effects remains uncertain
- Fed refers to " the extent of any additional policy firming that may be appropriate" vs the extent of additional policy firming that may be appropriate"
There has been a straightforward dovish reaction to this statement with the US dollar falling, Treasury yields dropping and US equities bid.
Dot plot:
- Dec 2024 median dot vs 5.1% prior
- Dec 2025 median dot vs 3.9% prior
- Dec 2026 median dot vs 2.9% prior
- Longer run Fed funds projection vs 2.5% prior
Growth projections
- 2023 GDP 2.6% vs 2.1% prior
- 2024 GDP 1.4% vs 1.5% prior
- 2025 GDP 1.8% vs 1.8% prior
Unemployment projections:
- 2023 unemployment 3.8% vs 3.8% prior
- 2024 unemployment 4.1% vs 4.1% prior
- 2025 unemployment 4.1% vs 4.1% prior
Inflation:
- 2023 PCE inflation 2.8% vs 3.3% prior
- 2024 PCE inflation 2.4% vs 2.5% prior
- 2025 PCE inflation 2.1% vs 2.2% prior
Core inflation:
- 2023 PCE core inflation 3.2% vs 3.7% prior
- 2024 PCE core inflation 2.4% vs 2.6% prior
- 2025 PCE core inflation 2.2% vs 2.3% prior
The previous economic projections were made at the Sept 20 FOMC meeting.
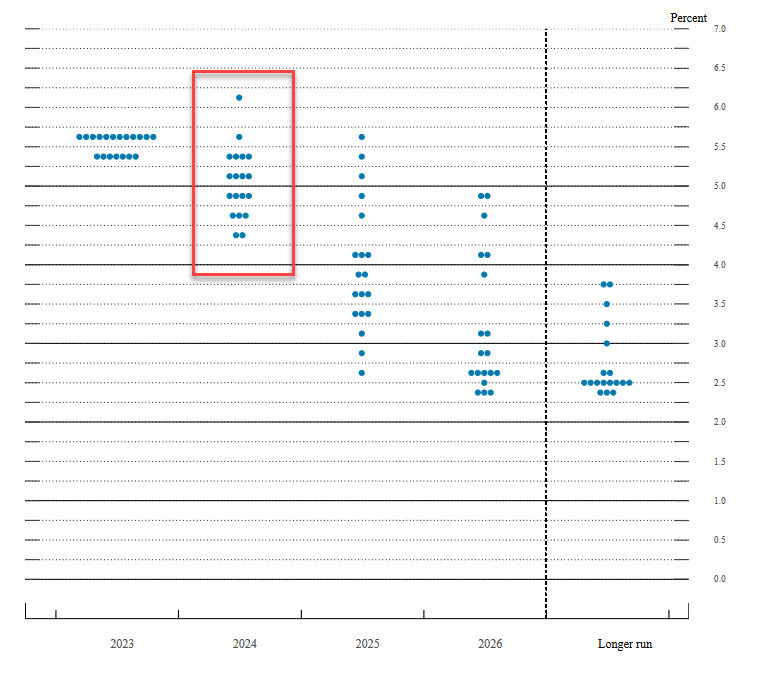
Fed dot plot from the Sept 20 meeting


