- Prior month 0.4%
- Home price data for 20 markets in the month of March fell -0.1% versus 0.3% estimate
- YoY 20 market home price index 4.1% vs 4.5% estimate. Last month 4.5%
Nicholas Godec Head of Fixed Income Tradables & Commodities at S&P Dow Jones Indices
“Home price growth continued to decelerate on an annual basis in March, even as the market experienced its strongest monthly gains so far in 2025,.This divergence between slowing year-over-year appreciation and renewed spring momentum highlighted how the housing market shifted from mere resilience to a broader seasonal recovery. Limited supply and steady demand drove prices higher across most metropolitan areas, despite affordability challenges remaining firmly in place."
Regionally:
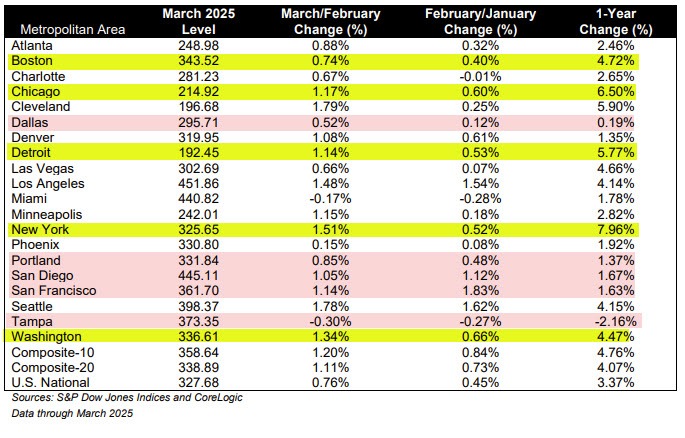
“Regional price trends remained varied. New York again reported the highest annual gain among the 20 cities, with prices up 8.0% year over year in March, followed by Chicago (+6.5%) and Cleveland (+5.9%). At the other end of the spectrum, Dallas barely stayed positive at +0.2% YoY, and Tampa saw prices fall 2.2%, making it the only metro to post a year-over-year decline. These results underscored how markets that experienced sharp run-ups earlier in the cycle – particularly in the Sun Belt – continued to adjust under the weight of higher mortgage rates and strained affordability.
Below is the % change for the most recent months and YoY values.