
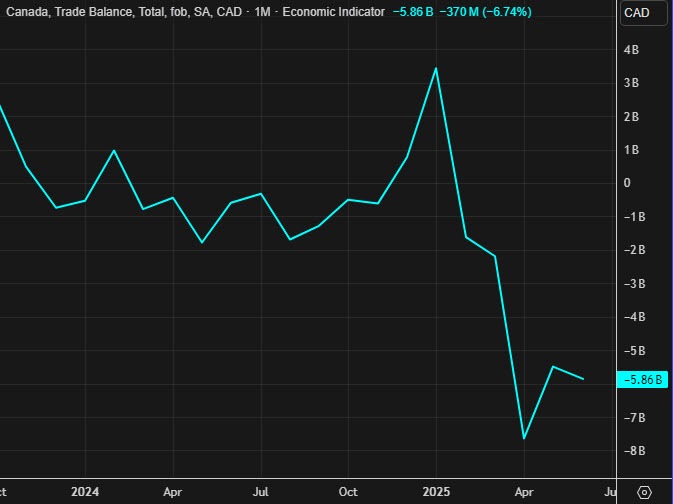
- Prior month C$-5.9 billion revised to -C$5.49 billion prior
- Canada trade balance for June C$5.86B vs -C$6.3B estimate
- Export $61.74 billion versus $61.2 billion last month
- Imports $67.6 billion versus $66.69 billion last
Details:
- In June, Canadian exports to the U.S. rose 3.1% from May but remained 12.5% lower year-over-year. Imports from the U.S. increased 2.6%, ending a three-month decline, largely due to a module purchase for an offshore oil project. As a result, Canada’s merchandise trade surplus with the U.S. widened from $3.6B in May to $3.9B in June
- In June, exports to countries other than the U.S. fell 4.1% from May—the first drop since February—though they were still 14.7% higher year-over-year. The decline was driven by lower shipments to the UK (unwrought gold) and Japan (iron ore), partly offset by gains to China (canola, copper ore). Imports from non-U.S. countries slipped 0.3%, but Canada’s trade deficit with these partners widened from $9.1B in May to $9.8B in June
After hitting a record high in Q1, Canada’s total exports fell 12.8% in Q2, down 5.4% year-over-year, led by steep drops in energy products (-19.5%), motor vehicles and parts (-16.6%), and consumer goods (-16.6%). Imports declined 3.9%, with lower motor vehicles and parts (-11.9%) and consumer goods (-4.0%) partly offset by a surge in metal and non-metallic mineral products (+18.6%).The merchandise trade balance swung sharply to a record $19.0B deficit from a $388M deficit in Q1. In real terms, exports fell 9.0% while imports slipped 1.5% in Q2.
The US and Canada are still negotiating. The surplus remains.
Visit investingLive.com (formerly ForexLive.com) for additional views.
