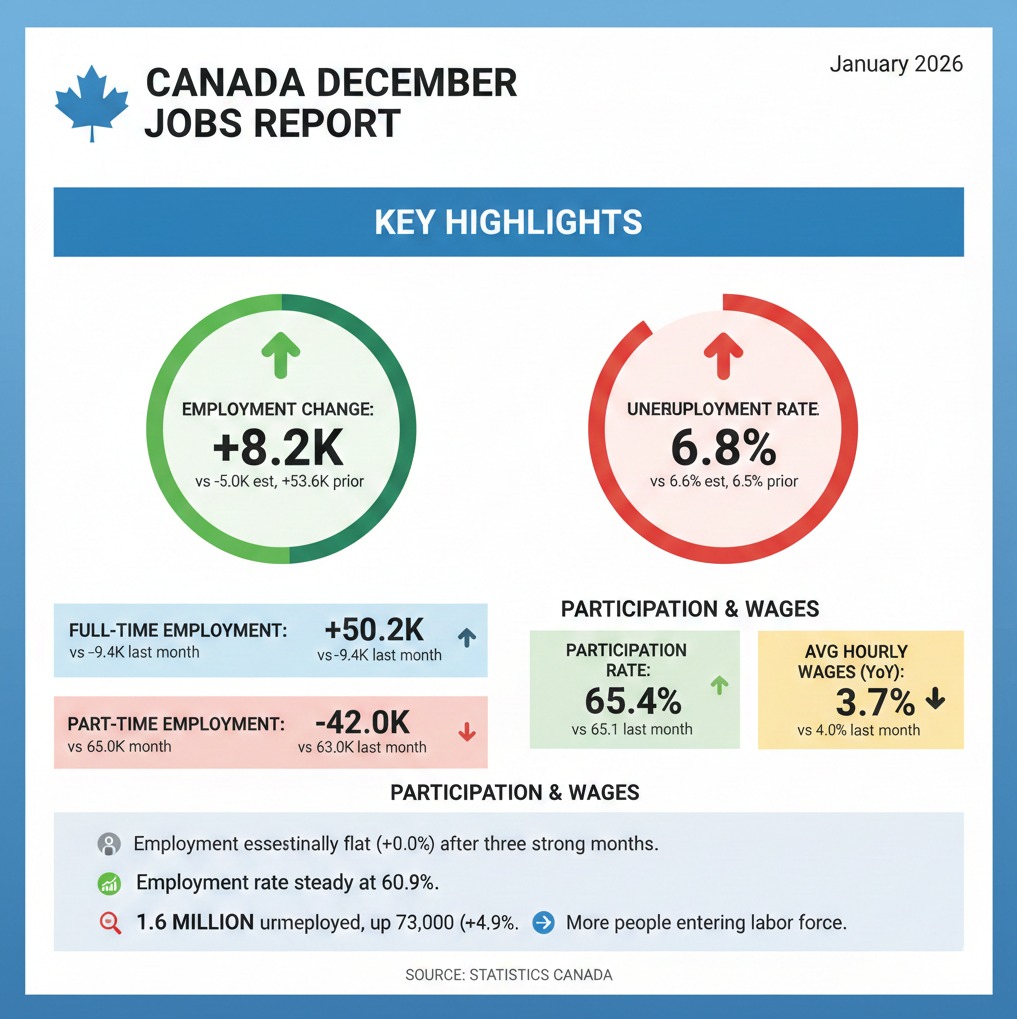
The Canada December jobs statistics show:
Employment change: 8.2 K vs -5.0K estimate, +53.6K prior
Unemployment rate: 6.8% vs 6.6% estimate, 6.5% prior
Full-time employment change: 50.2K vs -9.4k last month
Part-time employment change: -42.0K vs 63.0K last momth
Participation rate: 65.4% vs 65.1% last month
Avg hourly wages (permanent, YoY): 3.7% vs 4.0% last month
Highlights:
Employment was essentially flat in December, rising by 8,200 (0.0%), after three strong monthly gains from September through November.
The employment rate —the percentage of the population aged 15 years and older who are employed—held steady at 60.9%.
Full-time employment increased by 50,000 (+0.3%), while part-time employment fell by 42,000 (-1.1%), partially reversing gains from October and November.
Over the past 12 months, part-time employment grew faster (+2.6%) than full-time employment (+0.7%).
Private sector, public sector, and self-employment levels showed little change in December.
The unemployment rate rose by 0.3 percentage points to 6.8% in December, partially reversing declines from the prior two months.
The number of unemployed increased to 1.6 million, up 73,000 (+4.9%) on the month.
The participation rate increased by 0.3 percentage points to 65.4%, reflecting more people entering or re-entering the labor force.
On a year-over-year basis, the participation rate was unchanged.
Canada’s December labour market report showed mixed but stabilizing conditions. Employment edged up by 8.2K, outperforming expectations for a decline, but marking a sharp slowdown after strong gains in prior months. The unemployment rate rose to 6.8%, slightly above estimates and up from November, largely reflecting an increase in labour force participation rather than renewed job losses. Full-time employment rebounded strongly (+50.2K) after a decline in November, while part-time employment fell (-42.0K), partially unwinding earlier gains. The participation rate increased to 65.4%, indicating more people entering or re-entering the labour market, while the employment rate held steady at 60.9%. Wage growth moderated to 3.7% YoY, down from 4.0% previously. Overall, the data suggest the labour market cooled at year-end but remains relatively resilient, with improving full-time job creation offset by higher unemployment driven by increased labour supply.
Summary: 2025 labour market trend (Canada)
The Canadian labour market faced headwinds through most of 2025, with hiring slowing amid economic and trade uncertainty, particularly related to U.S. tariffs.
From January to August, employment was essentially flat, the employment rate declined, and the unemployment rate rose to a multi-year high of 7.1%, driven mainly by weaker hiring rather than layoffs.
Job finding rates deteriorated early in the year, while layoff rates remained near historical norms, indicating softer labour demand rather than widespread job losses.
Job vacancies declined, and employers reported less difficulty filling positions, pointing to a cooling labour market.
Youth were disproportionately affected, with youth unemployment and student joblessness reaching their highest levels in more than a decade (excluding pandemic years).
Conditions improved late in the year, with employment rebounding from August to November and the employment rate recovering to 60.9%.
The unemployment rate fell to 6.5% in November before edging higher to 6.8% in December, reflecting renewed labour force participation rather than renewed job losses.
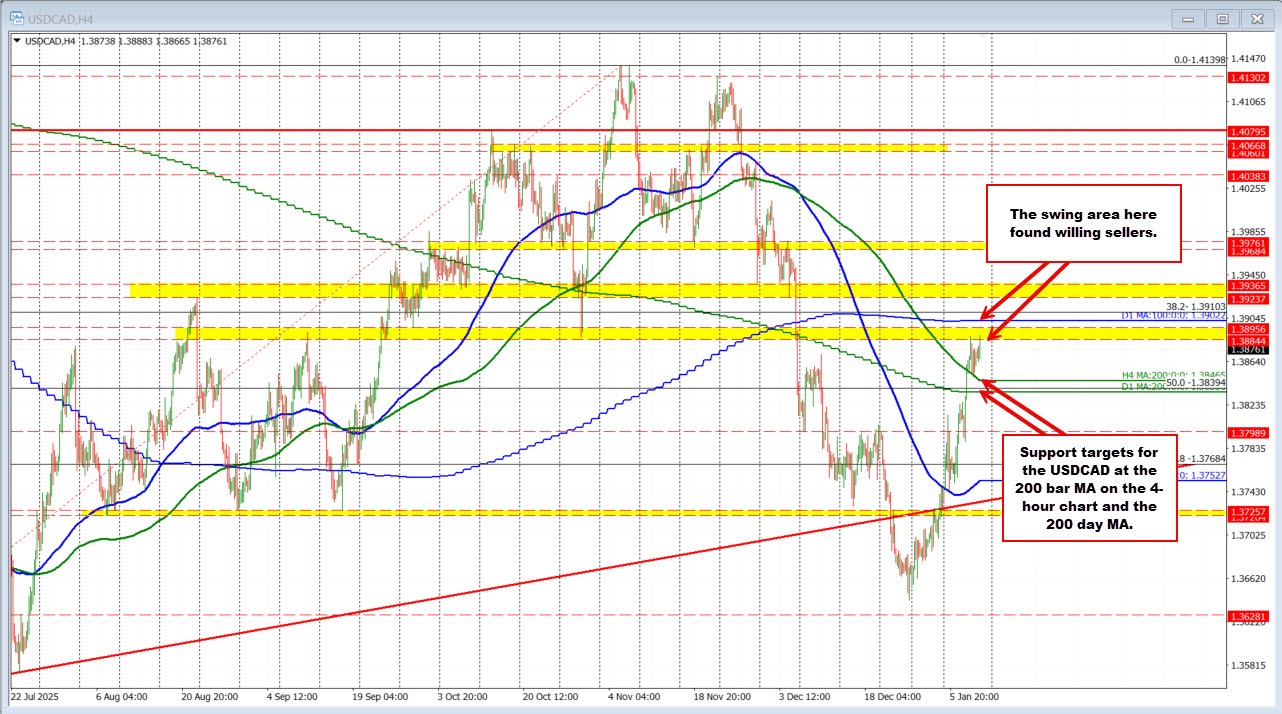
USDCAD moved to a new high after the report but backs off
USDCAD initially pushed higher following the US and Canada jobs data, reaching a session high at 1.3888, but the rally quickly stalled and the pair has since rotated lower, trading near European session lows around 1.3866. The move higher carried price into a well-defined swing resistance zone between 1.3884 and 1.3896, with the high also falling just shy of the 100-day moving average at 1.3902. That confluence of resistance attracted sellers, capping the upside and triggering the subsequent pullback.
On the downside, attention shifts to the 200-bar moving average on the 4-hour chart at 1.38465, with the 200-day moving average at 1.3837 just below. A move down toward—and especially through—this moving-average cluster would increase downside momentum and tilt the near-term bias more firmly in favor of sellers.