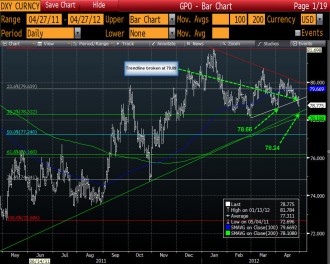
The price on the dollar index has fallen below trendline resistance today at the 79.09 level on the daily chart above.
- The next downside target on the daily chart is the low for the month of April at 78.66. The low today has come in at 78.70. Some buyers may be using that month low to define risk.
- Below this level is the 38.2% retracement of the move up from the July low at the 78.589
- Lower trend line support and the 200 day MA comes in at 78.24 and 78.10
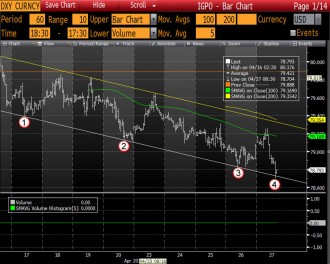
Looking at the hourly chart,
- There is some additional support against bottom trendline support on this chart at the 78 .72 level.
- This level, coupled with the test of the low from April at the 78.66, could provide a reason for a technical bounce.
- At the least, risk is defined and limited. To buy would be trading against what is the trend, but it is Friday and the steady move down in the index this week, may solicit some profit taking buying before the weekend.