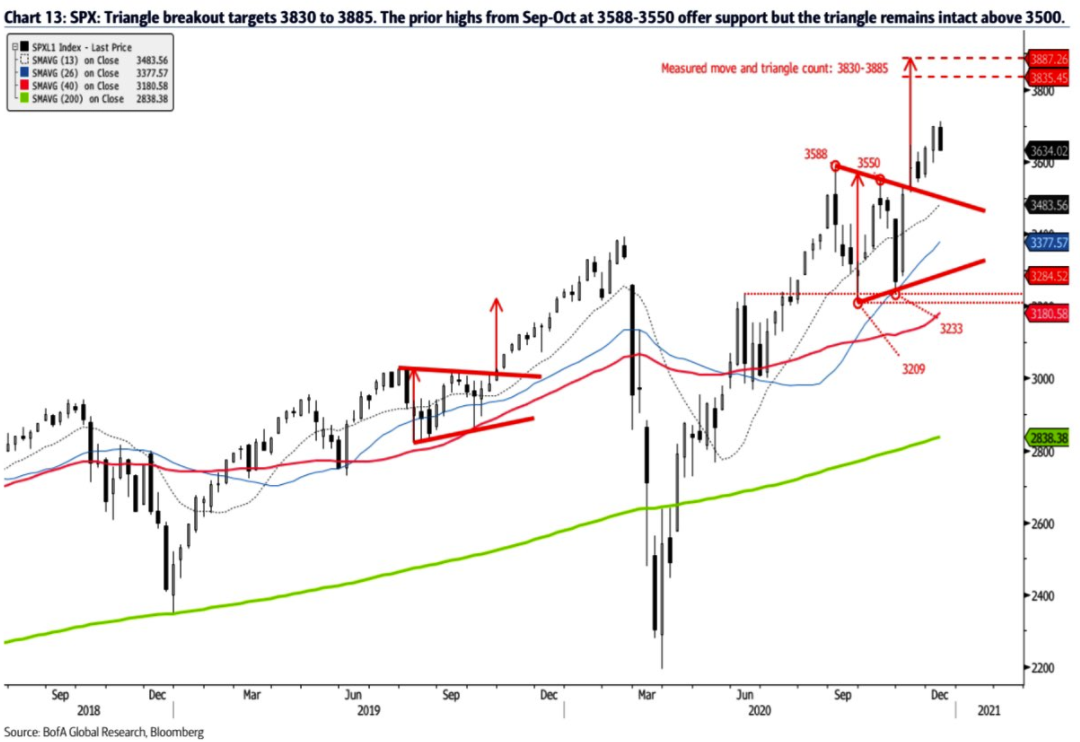
Bank of America / Merrill Lynch chart on the S&P500
Comments accompanying the chart:
- The SPX broke out from the bullish triangle pattern that we highlighted heading into the US Presidential Election.
- This triangle projects further upside to 3830 (measured move) and 3885 (triangle count) into early 2021.
- The prior highs from September-October at 3588-3550 offer support, but the triangle breakout stays intact above 3500. Rising 26 and 40-week MAs near the 3377-3180 range define a bullish trading cycle or uptrend and offer additional support.
