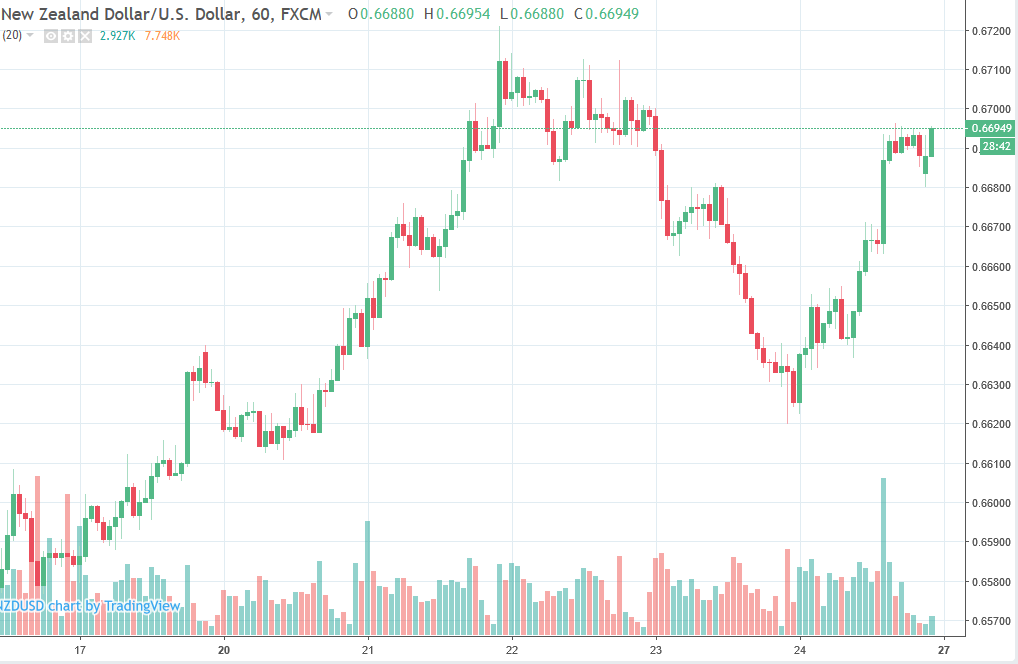
Stop loss buyers clustered above the figure and again above 0.6720/25
The chart is showing the 0.67 level clearly. Above there is a bit of a mess, but there are more stops clustered above 20/25
The chart is showing the 0.67 level clearly. Above there is a bit of a mess, but there are more stops clustered above 20/25
