
Fundamental Overview
The USD sold off across the board on Friday following another soft NFP report. The dovish bets on the Fed increased as a result and the market is now expecting three rate cuts by year-end (70 bps). Moreover, we have also a 10% probability of a 50 bps cut in September but that will likely happen only if we get a soft CPI report on Thursday. In that case, the greenback will likely weaken further into the FOMC meeting and might finally get us out of the range.
Overall, if one zooms out, the US dollar continues to range although the dovish bets on the Fed keep weighing on the currency. Part of that could be the fact that the bearish positioning on the dollar could be overstretched and we might be at the peak of the dovish pricing.
In fact, if the rate cuts trigger stronger economic activity in the next months, the rate cuts in 2026 could be priced out and support the dollar. Nevertheless, the trend is still skewed to the downside, and we might need strong data to reverse it.
On the JPY side, we haven’t got meaningful changes in the fundamentals. Over the weekend, Japanese PM Ishiba resigned and that weighed on the yen with the currency gapping lower on Monday open. But as it generally happens with such political stuff, the gap was eventually closed and the yen returned trading at pre-Ishiba resignation levels.
The yen has been rallying mostly on the back of the dovish expectations for the Fed. For more JPY appreciation we will need weak US data to increase the dovish bets on the Fed or a series of higher inflation figures for Japan to price in more rate hikes than currently expected.
USDJPY Technical Analysis – Daily Timeframe
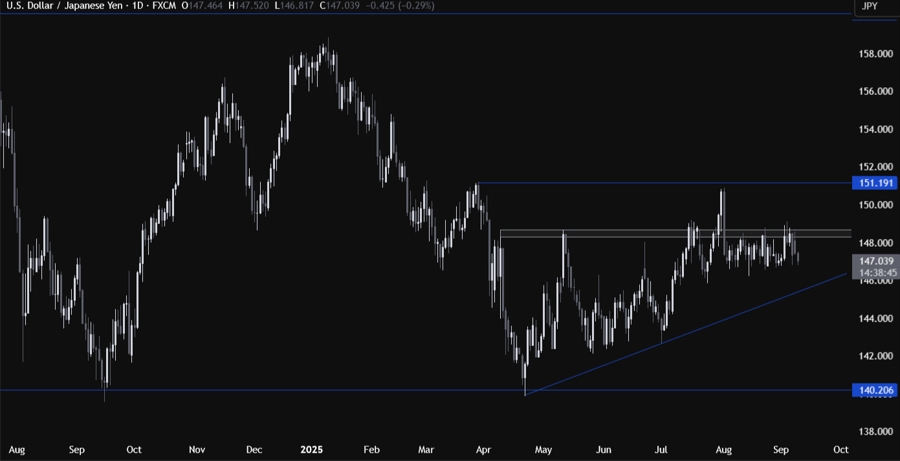
On the daily chart, we can see that USDJPY eventually got rejected once again from the major 148.50 resistance zone. The sellers will continue to target the major trendline around the 145.50 level, while the buyers will likely step in around the trendline with a defined risk below it to position for a rally into the 151.00 handle next.
USDJPY Technical Analysis – 4 hour Timeframe
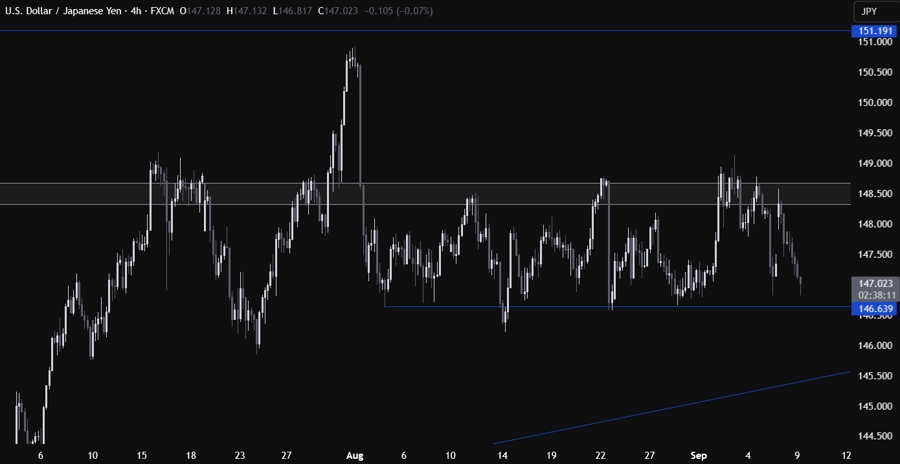
On the 4 hour chart, we can see that despite all the important events and data releases, we’ve been stuck in a range for over a month. Traders will likely continue to play the range by buying at support and selling at resistance until we get a breakout on either side.
USDJPY Technical Analysis – 1 hour Timeframe
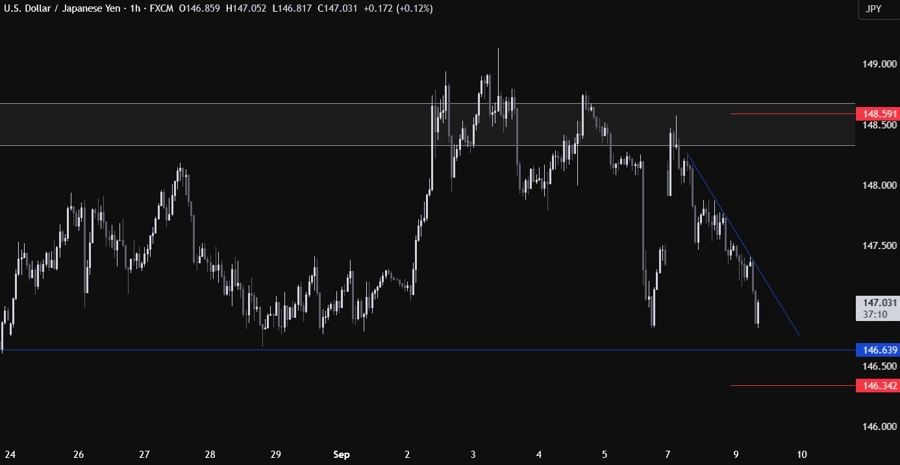
On the 1 hour chart, we can see that we have a minor downward trendline defining the bearish momentum on this timeframe. The sellers will likely continue to lean on the trendline to keep pushing into new lows, while the buyers will look for a break higher to position for a rally into the 148.50 resistance. The red lines define the average daily range for today.
Upcoming Catalysts
Tomorrow we get the US PPI report. On Thursday, we get the US CPI report and the latest US Jobless Claims figures. On Friday, we conclude the week with the University of Michigan Consumer Sentiment report.


