
Fundamental Overview
The USD weakened across the board recently following soft ADP data and a Bloomberg report saying that Hassett emerged as the frontrunner for the Fed Chair position.
The greenback was already under some pressure caused by Fed’s Williams endorsement for a December cut last Friday. The probability for a December cut is now at 76%, which generally makes it a done deal.
We won’t get much data before the FOMC meeting, so the focus will likely be mainly on jobless claims and ADP data, which haven’t been showing any strong improvement. Weak data should keep weighing on the greenback, while strong data could provide some short-term support. At the end of the day though, it’s all about the FOMC decision now and the following NFP and CPI reports.
On the JPY side, nothing has changed. The currency has been weakening since the last BoJ policy decision where the central bank left interest rates unchanged as expected with again two dissenters voting for a hike.
There were no surprises but Governor Ueda focusing on spring wage negotiations suggested that the next hike could be delayed to January or even March 2026. The probabilities for a December hike rose a little to 33% recently as speculation of a possible hike due to the fast yen depreciation strengthened.
USDJPY Technical Analysis – Daily Timeframe
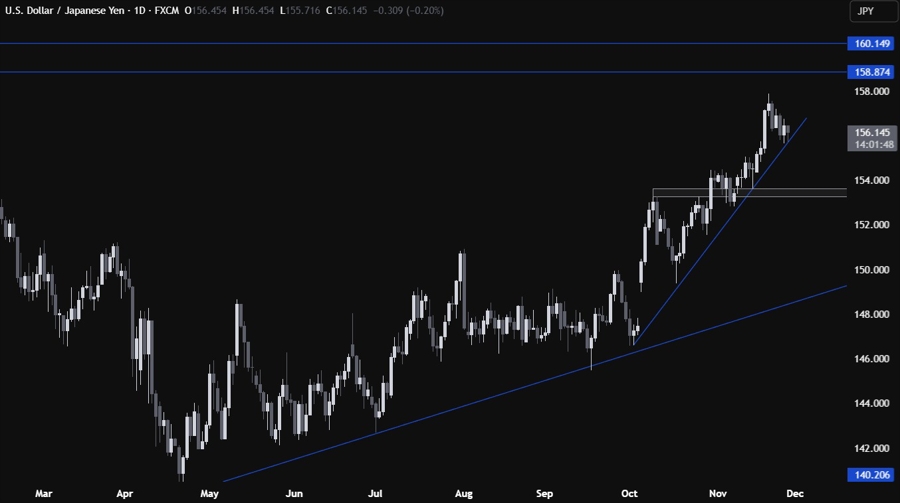
On the daily chart, we can see that USDJPY is bouncing near the trendline as the buyers are stepping in with a defined risk below the trendline to position for a rally into the 158.87 level. The sellers, on the other hand, will want to see the price breaking lower to pile in for a drop into the 153.50 support next.
USDJPY Technical Analysis – 4 hour Timeframe
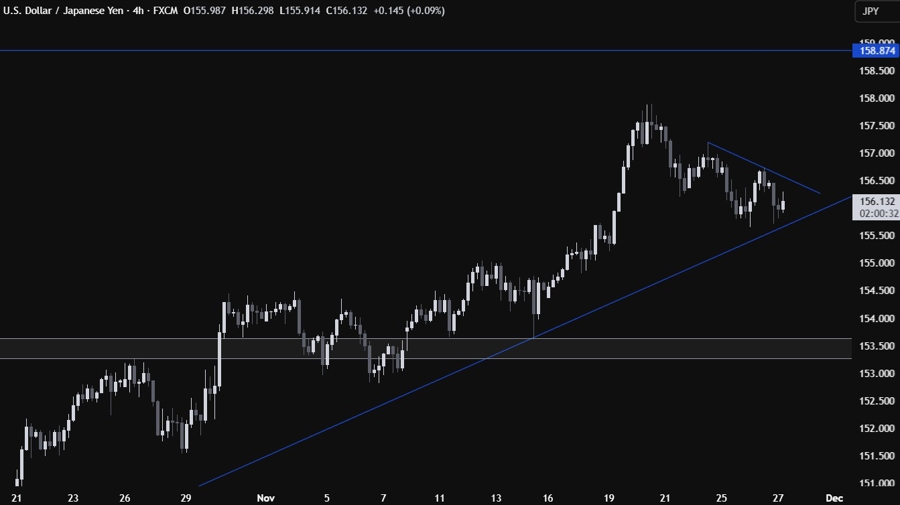
On the 4 hour chart, we can see that we have a minor downward trendline defining the current pullback. The sellers will likely lean on the trendline with a defined risk above it to target a break below the major upward trendline. The buyers, on the other hand, will look for a break higher to increase the bullish bets into the 158.87 level next.
USDJPY Technical Analysis – 1 hour Timeframe
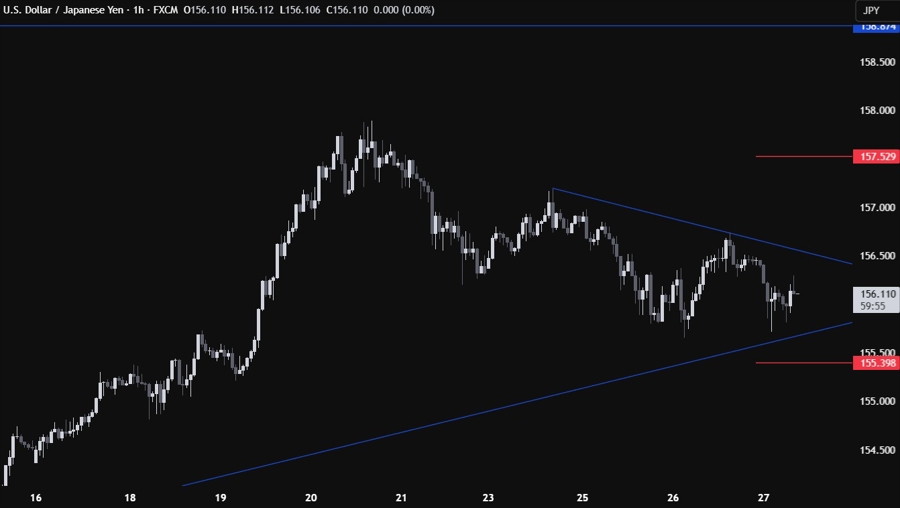
On the 1 hour chart, there’s not much else we can add here as the price is trading right in the middle of the two key trendlines, so the market participants will wait for the price to come into either of those. The red lines define the average daily range for today.
Upcoming Catalysts
Tomorrow we conclude the week with the Tokyo CPI report.
