
Fundamental Overview
The USD remains weak across the board as market participants now await the key US data releases with the government shutdown expected to end this week. Yesterday, we saw some more weakness following soft weekly ADP data that showed job losses in the second half of October.
The weakness didn’t hold though as the US dollar eventually regained some ground. It seems like the market is now just waiting for the government data to confirm the weakness and the December cut. In fact, the market pricing is still standing around 64% probability for a December cut.
On the JPY side, the currency has been weakening since last BoJ policy decision where the central bank left interest rates unchanged as expected with again two dissenters voting for a hike. There were no surprises but Governor Ueda focusing on spring wage negotiations suggested that the next hike could be delayed to January or even March 2026.
We got some verbal intervention last week from the Japanese Finance Minister near the 155.00 handle and another one today. This is generally just short-term stuff that provides pullbacks for traders as long as the conditions for more yen weakness persist. But it shows that the 155.00 level is where the Japanese officials start to draw a line.
USDJPY Technical Analysis – Daily Timeframe
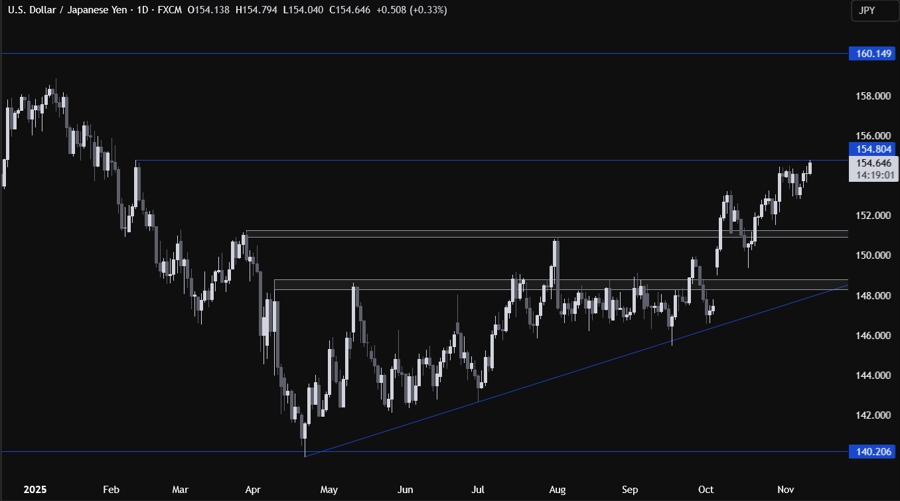
On the daily chart, we can see that USDJPY reached the key 154.80 level. This is where we can expect the sellers to step in with a defined risk above the level to position for a drop into the 151.00 support. The buyers, on the other hand, will want to see the price breaking higher to increase the bullish bets into the 158.00 handle next.
USDJPY Technical Analysis – 4 hour Timeframe
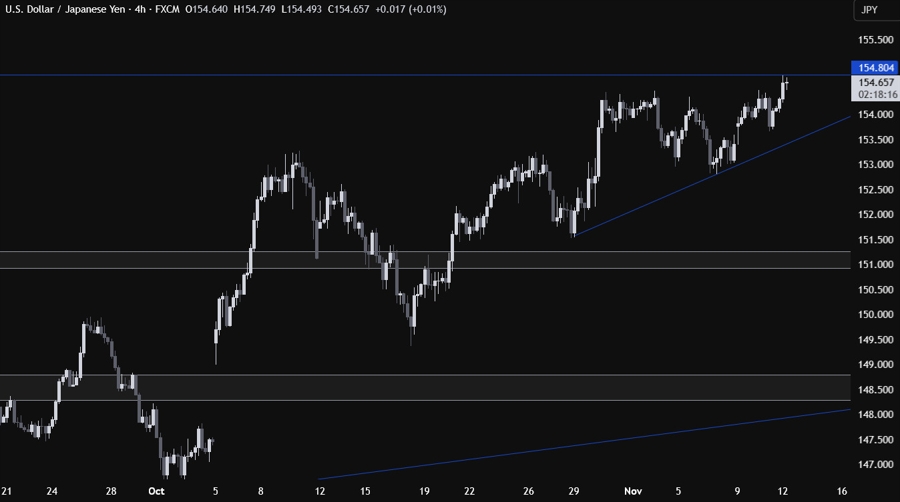
On the 4 hour chart, we can see that we have an upward trendline defining the bullish momentum. If we get a pullback into it, we can expect the buyers to lean on the trendline with a defined risk below it to position for a rally into new highs. The sellers, on the other hand, will look for a break lower to increase the bearish bets into the 151.00 support.
USDJPY Technical Analysis – 1 hour Timeframe
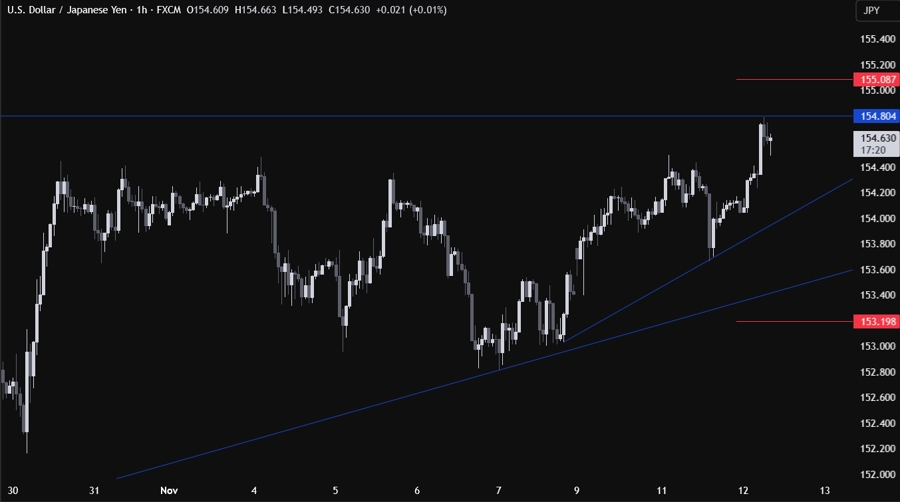
On the 1 hour chart, we can see that we have another minor upward trendline defining the bullish momentum on this timeframe. Again, the buyers will likely lean on the trendline to keep pushing into new highs, while the sellers will look for a break lower to increase the bearish bets into new lows. The red lines define the average daily range for today.
