
Fundamental Overview
The USD continues to remain one of the weakest major currencies as the good news on the tariffs front and the lower than expected US inflation figures of last week kept the positive risk sentiment going. The market is still expecting roughly two rate cuts by year-end for the Fed but overall, we are just in rangebound mode given the lack of meaningful changes in conditions in the past few weeks.
On the JPY side, the Tokyo CPI figures today came out lower than expected and didn’t help the JPY as a rate hike by year-end got already priced in after the US-Japan trade deal. For more appreciation we will likely need weak US data to increase the dovish bets on the Fed or higher inflation figures for Japan to price in more rate hikes than currently expected.
Watch also the political shifts as news of more fiscal support will lead the market to expect stronger economic activity and therefore higher chances of more rate hikes.
USDJPY Technical Analysis – Daily Timeframe
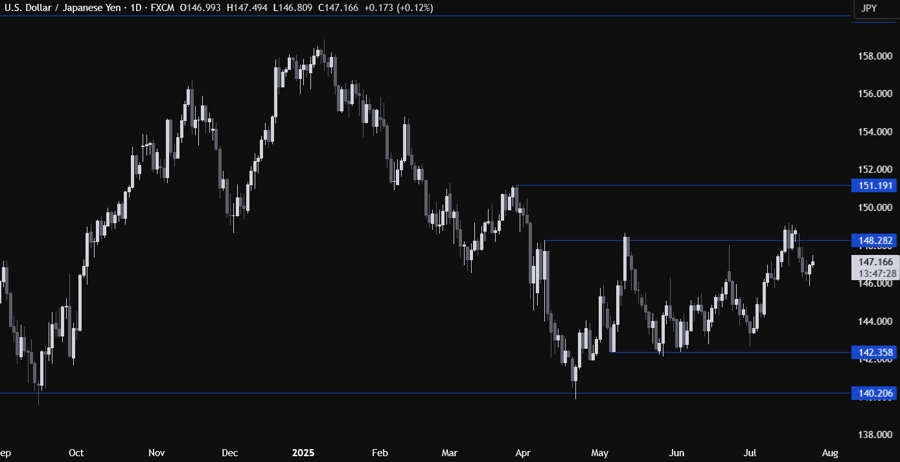
On the daily chart, we can see that USDJPY eventually fell back below the key 148.30 resistance and extended the drop into the 146.00 handle before bouncing back. The sellers will likely continue to step in around the 148.28 resistance with a defined risk above it to position for a drop into the 142.35 support. The buyers, on the other hand, will look for a break higher to increase the bullish bets into the 151.20 resistance next.
USDJPY Technical Analysis – 4 hour Timeframe
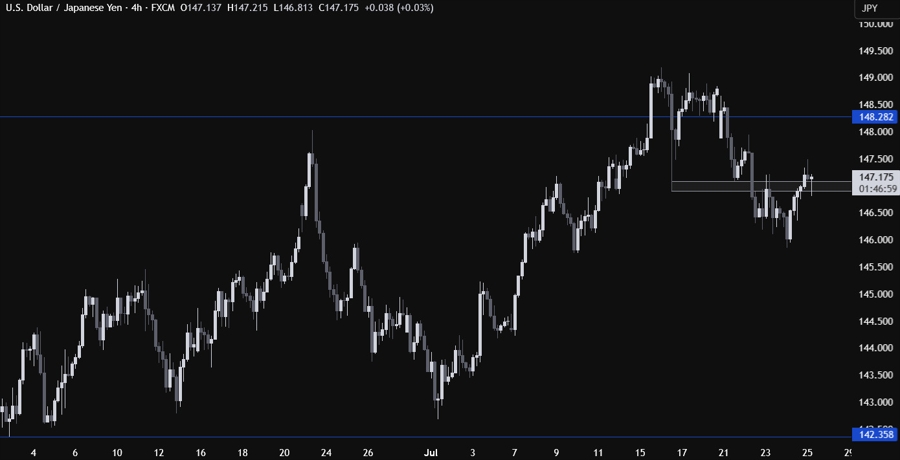
On the 4 hour chart, we can see that we a minor resistance zone around the 147.00 handle that now turned into support. The buyers will likely continue to pile in around these levels with a defined risk below the support to keep targeting a break above the 148.28 resistance. The sellers, on the other hand, will want to see the price breaking lower to increase the bearish bets into the 142.35 support next.
USDJPY Technical Analysis – 1 hour Timeframe
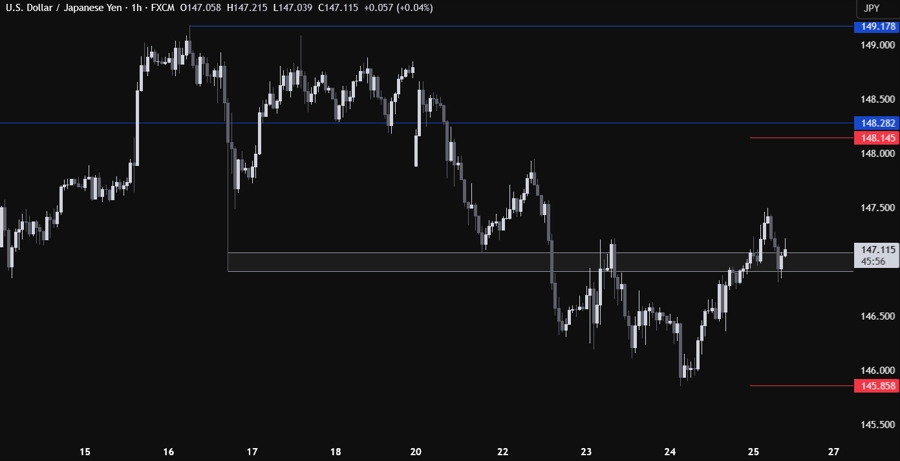
On the 1 hour chart, there’s not much else we can add here as the buyers will look for dip-buying opportunities around the support, while the sellers will look for a downside breakout to push into new lows. The red lines define the average daily range for today.


