
Fundamental Overview
The USD regained some ground in the past days but the momentum stalled as December rate cut odds jumped following Fed’s Williams dovish comments.
As of now, the December rate cut odds stand around 70% but we won’t get much data before the FOMC meeting, so the focus will likely be mainly on jobless claims and ADP data. Weak data should keep weighing on the greenback, while strong data could provide some short-term support.
On the JPY side, nothing has changed. The currency has been weakening since the last BoJ policy decision where the central bank left interest rates unchanged as expected with again two dissenters voting for a hike.
There were no surprises but Governor Ueda focusing on spring wage negotiations suggested that the next hike could be delayed to January or even March 2026. The probabilities for a December hike rose a little to 30% recently as speculation of a possible hike due to the fast yen depreciation strengthened.
USDJPY Technical Analysis – Daily Timeframe
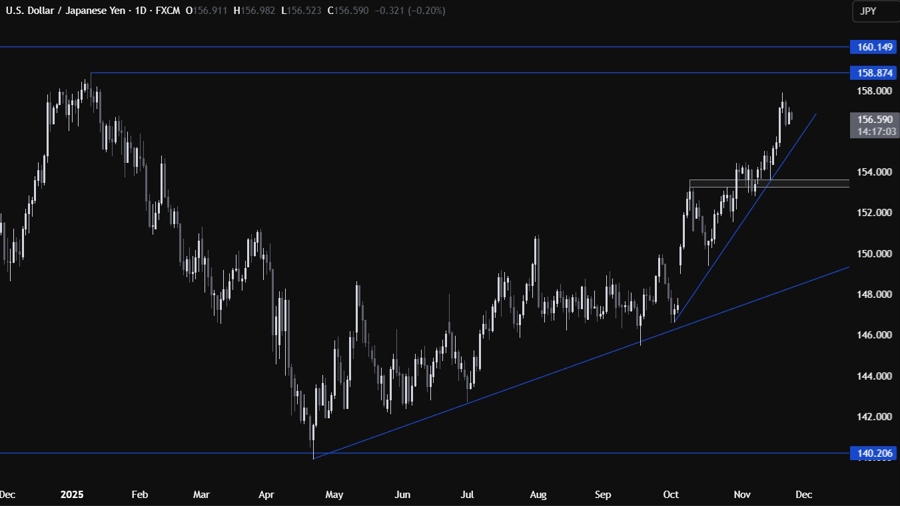
On the daily chart, we can see that USDJPY continues to pull back from the highs after a strong rally where we almost reached the 158.00 handle. We can see that we have an upward trendline defining the bullish momentum. The buyers will likely lean on the trendline with a defined risk below it to position for a rally into the 160.00 handle. The sellers, on the other hand, will look for a break lower to extend the pullback into the 154.00 level.
USDJPY Technical Analysis – 4 hour Timeframe
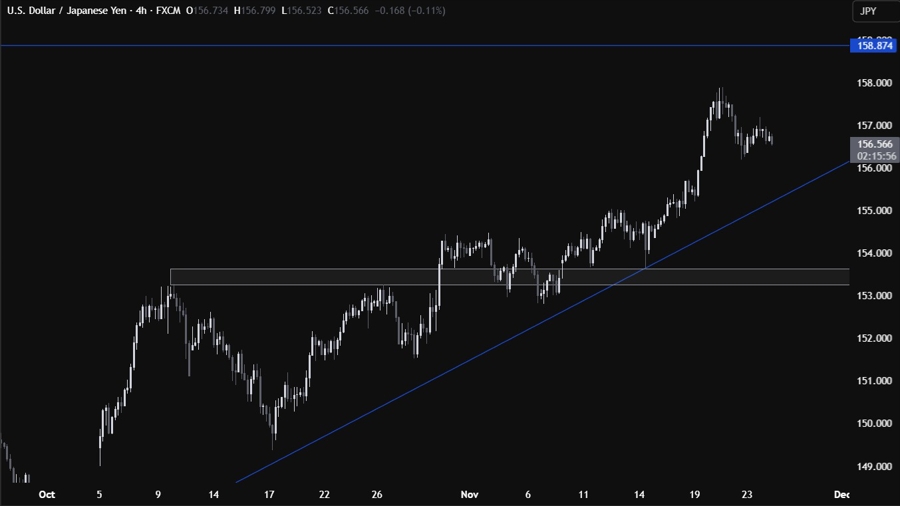
On the 4 hour chart, there’s not much else we can add here as the buyers will have a better risk to reward setup around the trendline, while the sellers will wait for a downside break to increase the bearish bets into new lows.
USDJPY Technical Analysis – 1 hour Timeframe
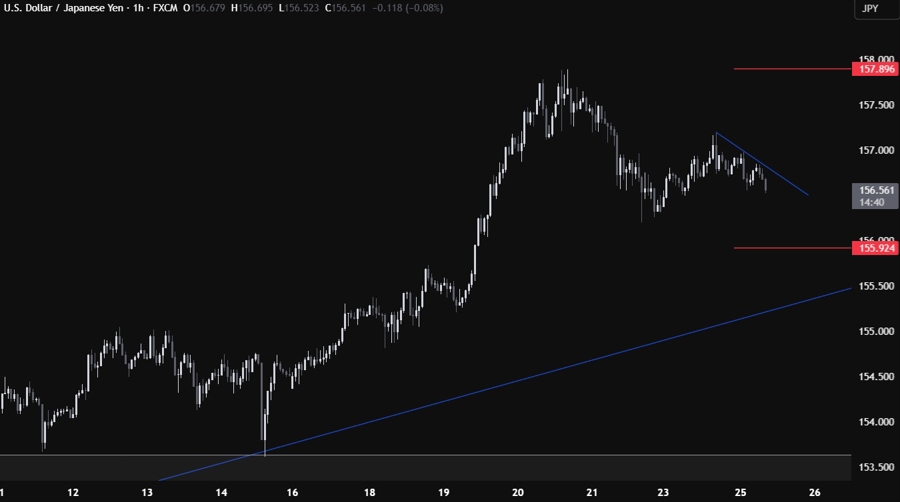
On the 1 hour chart, we can see that we have a minor downward trendline defining the current bearish momentum. The sellers will likely continue to lean on the trendline to keep pushing into the major upward trendline, while the buyers will look for a break higher to increase the bullish bets into new highs. The red lines define the average daily range for today.
Upcoming Catalysts
Today we get the weekly ADP jobs data and the US Consumer Confidence report. We will also get the September US PPI and Retail Sales reports. Tomorrow, we get the most recent US Jobless Claims figures and the September Durable Goods Orders report. On Thursday, we have the US Thanksgiving holiday, while on Friday we conclude the week with the Tokyo CPI report.
