
Fundamental Overview
The USD recovered most of the losses triggered by Powell’s dovish tilt at the Jackson Hole Symposium. Traders are now focused on the US labour market data due next week that will culminate with a crucial NFP report on Friday. In fact, the data will influence interest rates expectations greatly.
Right now, the market is pricing an 84% probability of a rate cut in September and a total of 54 bps of easing by year-end. Strong data might take the probability for a September cut towards a 50/50 chance but will certainly see a more hawkish repricing further down the curve and support the dollar. Soft data, on the other hand, will likely see traders increasing the dovish bets with a third cut by year-end being priced in and weighing on the greenback.
On the JPY side, the currency has been rallying on the back of the dovish expectations for the Fed. For more JPY appreciation we will need weak US data to increase the dovish bets on the Fed or a series of higher inflation figures for Japan to price in more rate hikes than currently expected. Another potential positive driver could be signs of more fiscal support as that will likely put upward pressure on inflation.
USDJPY Technical Analysis – Daily Timeframe
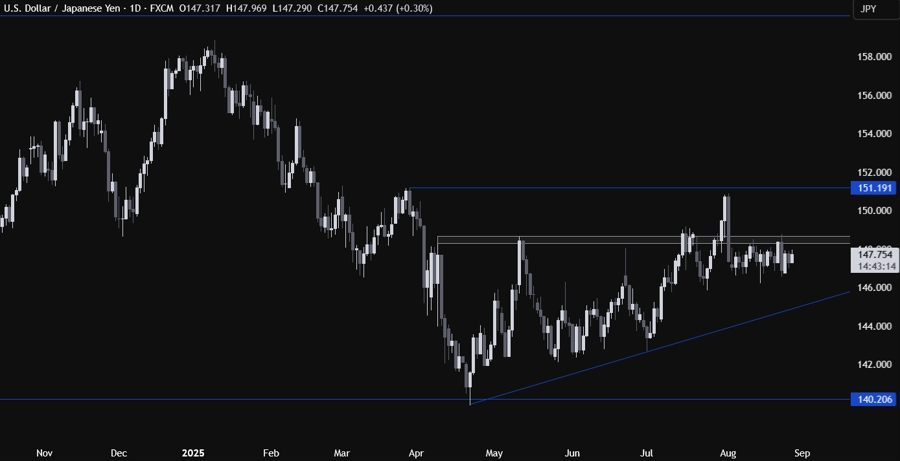
On the daily chart, we can see that USDJPY continues to range beneath the major 148.50 resistance zone as traders are waiting for the key US data next week. The sellers will likely continue to lean on the resistance to keep targeting the major trendline around the 145.50 level, while the buyers will look for a break higher to pile in for a rally into the 151.00 handle next.
USDJPY Technical Analysis – 4 hour Timeframe
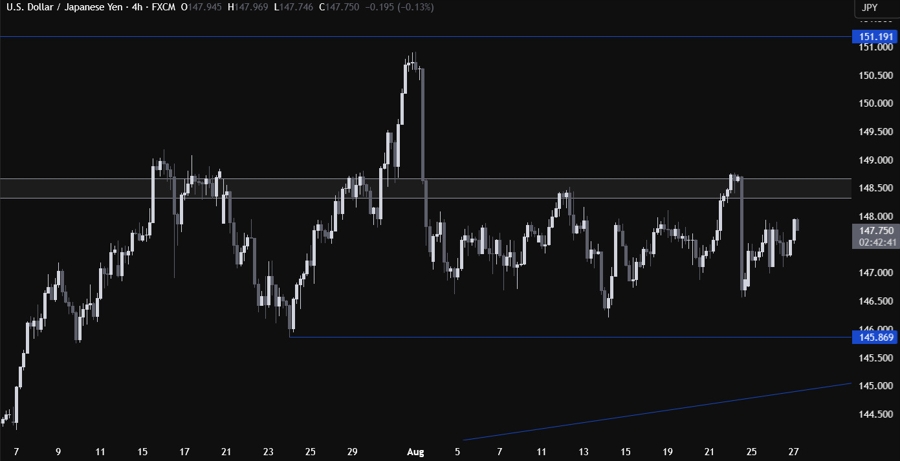
On the 4 hour chart, we can see that we’ve been stuck in a range for the entire month as traders have been waiting for Powell’s speech and now for the key data releases next week. There’s not much we can glean from this timeframe, so we need to zoom in to see some more details.
USDJPY Technical Analysis – 1 hour Timeframe
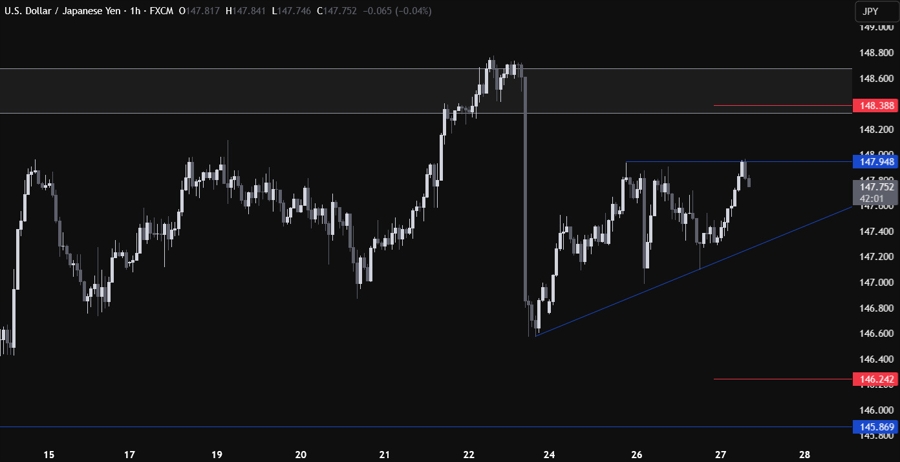
On the 1 hour chart, we can see that we have a minor upward trendline defining the bullish momentum on this timeframe and a minor resistance around the 147.95 level. The buyers will likely continue to lean on the trendline to keep pushing into new highs, while the sellers will look for a break lower to increase the bearish bets into new lows. The red lines define the average daily range for today.
Upcoming Catalysts
Tomorrow we get the latest US Jobless Claims figures. On Friday, we conclude the week with the Tokyo CPI and the US PCE price index.
