
Fundamental Overview
The USD regained some ground in the final part of last week and extended the gains this week, although we haven’t got any meaningful catalyst for the move. Overall, we continue to range as the market is waiting for something new for the next sustained trend.
Given that the “short US dollar” is now the most crowded trade, such quick unwinding moves are natural, and it will take something meaningful to lead the market to expect more rate cuts than currently priced in and weaken the greenback further.
On the JPY side, the focus has now switched to the BoJ. The market is now pricing much higher chances of a rate hike by year-end following the US-Japan trad deal. In fact, the central bank mentioned several times that they wanted to see first how things evolved with trade negotiations before adjusting interest rates.
For more JPY appreciation we will likely need weak US data to increase the dovish bets on the Fed or higher inflation figures for Japan to price in more rate hikes than currently expected. Other potential positive drivers could be a signal from the BoJ to deliver more rate hikes given lower uncertainty or signs of more fiscal support as that will likely put upward pressure on inflation.
USDJPY Technical Analysis – Daily Timeframe
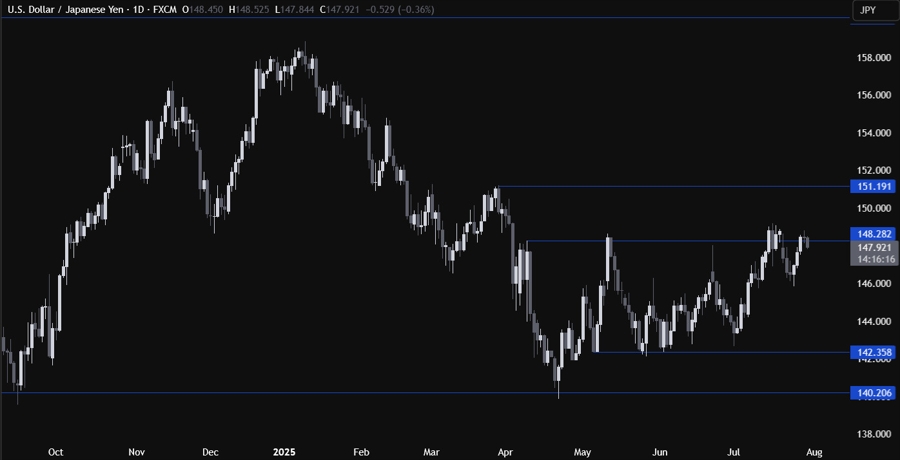
On the daily chart, we can see that USDJPY is rejecting once again the key resistance zone around the 148.30 level. The sellers stepped in there to position for a drop back into the 142.35 support. The buyers will need a clear breakout to extend the rally into the 151.20 level next.
USDJPY Technical Analysis – 4 hour Timeframe
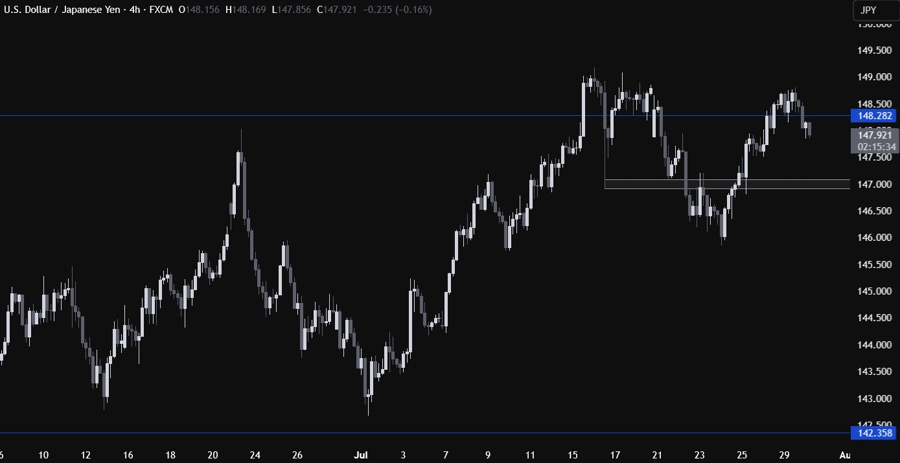
On the 4 hour chart, we can see that we have a minor support zone around the 147.00 handle. If the price gets there, we can expect the buyers to step in with a defined risk below the support to position for a rally back into the resistance targeting a breakout. The sellers, on the other hand, will look for a break lower to increase the bearish bets into the 142.35 level next.
USDJPY Technical Analysis – 1 hour Timeframe
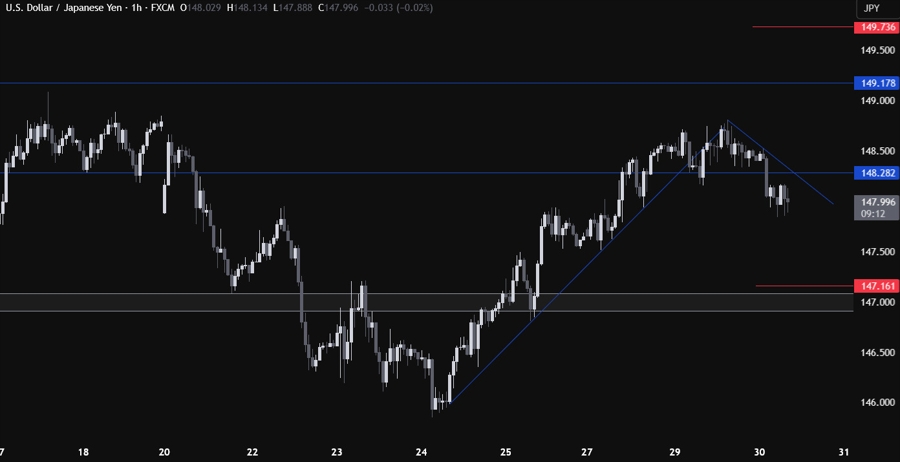
On the 1 hour chart, we can see that we broke below the upward trendline that was defining the bullish momentum on this timeframe. We now have a minor downward trendline defining the current pullback. The sellers will likely continue to lean on it to keep pushing into new lows, while the buyers will look for a break higher to target the 151.20 resistance next. The red lines define the average daily range for today.
Upcoming Catalysts
Today we have the US ADP, the US Q2 GDP and the FOMC rate decision. Tomorrow, we have the BoJ rate decision, the US PCE price index, the US Jobless Claims and the US Employment Cost Index. Finally, on Friday, we conclude the week with the US NFP report and the US ISM Manufacturing PMI.


