
Fundamental Overview
The USD has weakened pretty much across the board last week despite a strong US ADP and ISM Services PMI. As mentioned previously, when markets react like that it’s generally a signal of a short-term top with the market needing more to keep the trend going.
In fact, the market pricing is now showing a 63% probability of a December cut, which is about right. The NFP and CPI reports will have the final say, and hopefully we will get them before the next FOMC decision.
On the JPY side, the currency has been weakening since last BoJ policy decision where the central bank left interest rates unchanged as expected with again two dissenters voting for a hike. There were no surprises but Governor Ueda focusing on spring wage negotiations suggested that the next hike could be delayed to January or even March 2026.
We got some verbal intervention last week from the Japanese Finance Minister near the 155.00 handle. This is generally just short-term stuff that provides pullbacks for traders as long as the conditions for more yen weakness persist. But it shows that the 155.00 level is where the Japanese officials start to draw a line.
USDJPY Technical Analysis – Daily Timeframe
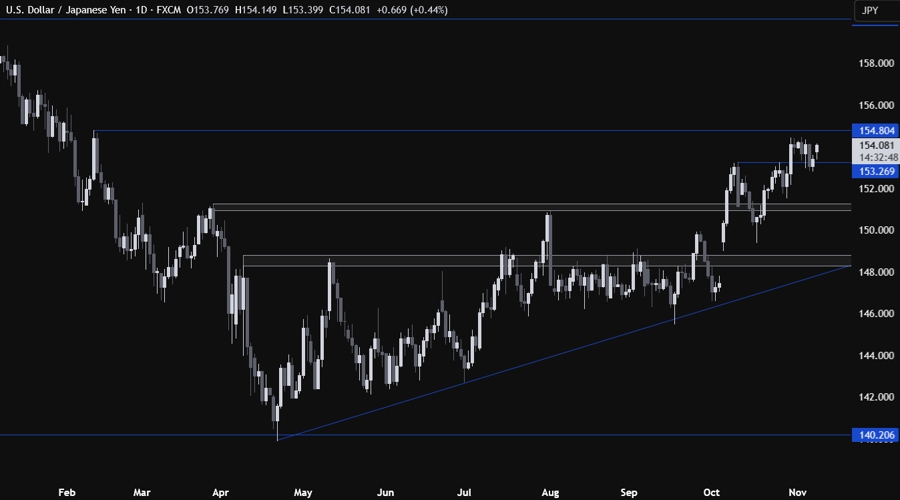
On the daily chart, we can see that USDJPY probed below the 153.27 level but eventually bounced back above it. The price action has been kind of rangebound below the 155.00 handle as market participants await new catalysts.
USDJPY Technical Analysis – 4 hour Timeframe
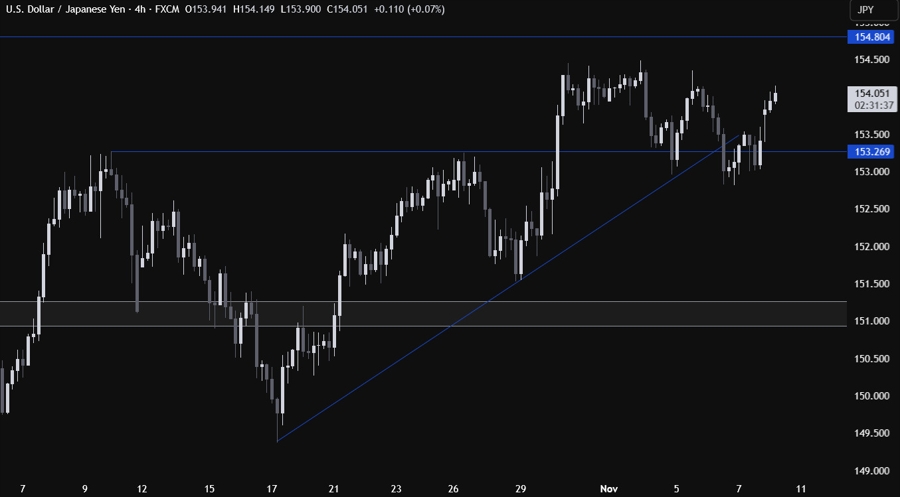
On the 4 hour chart, we can see more clearly the rangebound price action above the 153.00 handle. We got a break below the upward trendline last week, but it turned out to be a fakeout. There’s not much we can add, so we need to zoom in to see some more details.
USDJPY Technical Analysis – 1 hour Timeframe
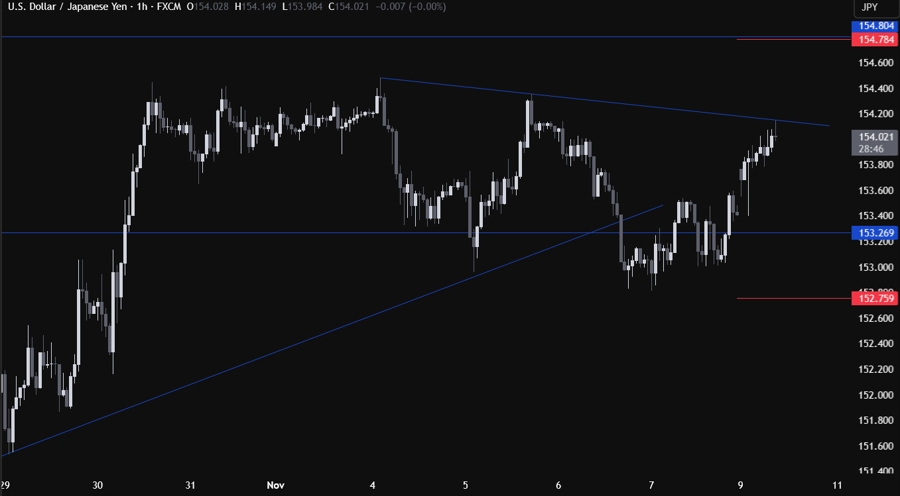
On the 1 hour chart, we can see that we have a downward trendline acting as resistance. This is where the sellers are stepping in with a defined risk above the trendline to position for a drop into new lows. The buyers, on the other hand, will want to see the price breaking higher to increase the bullish bets into new highs. The red lines define the average daily range for today.
Upcoming Catalysts
This week is pretty empty on the data front. We just have the weekly US ADP data tomorrow.
