
Fundamental Overview
The USD weakened across the board on the Fed’s decision but eventually erased all the losses and increased the gains as traders digested all the information and realised the projected rate path was more hawkish than market’s pricing.
In fact, the dot plot showed that the FOMC projected two more rate cuts for 2025 by a narrow majority, with the rest of officials expecting just one more or even none. Moreover, the Fed projected just one cut in 2026 compared to three that the market was pricing before the decision.
Fed Chair Powell then labelled the rate cut as a “risk management” move given the weakening in the labour market data. But overall, he sounded pretty neutral even though he understandably placed more emphasis on the labour market given the two consecutive soft NFP reports.
The day after the FOMC decision, we got a solid US jobless claims report, and the greenback increased the gains further. Looking forward, it’s going to be all about the data. Strong data will likely trigger a hawkish repricing in interest rates expectations and support the greenback. On the other hand, weak data will likely continue to weigh on it.
On the JPY side, the BoJ kept interest rates unchanged as expected last week but the market got surprised by two members voting for a rate hike. The yen initially rallied but once Governor Ueda started speaking, the gains began to fade and eventually got erased completely as Ueda downplayed the dissenting votes.
USDJPY Technical Analysis – Daily Timeframe
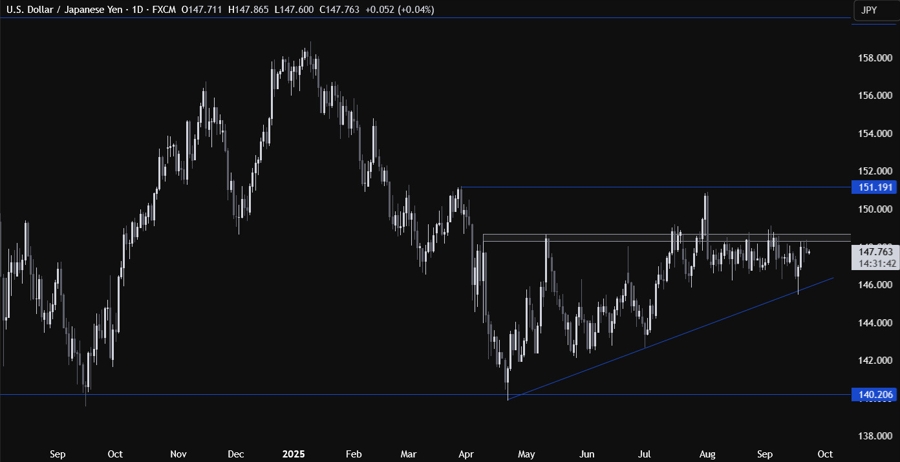
On the daily chart, we can see that USDJPY eventually rallied all the way back to the key resistance zone around the 148.50 level. That’s where we can expect the sellers to step in with a defined risk above the resistance to position for a drop back into the major trendline around the 146.00 handle. The buyers, on the other hand, will want to see the price breaking higher to increase the bullish bets into the 151.00 handle next.
USDJPY Technical Analysis – 4 hour Timeframe
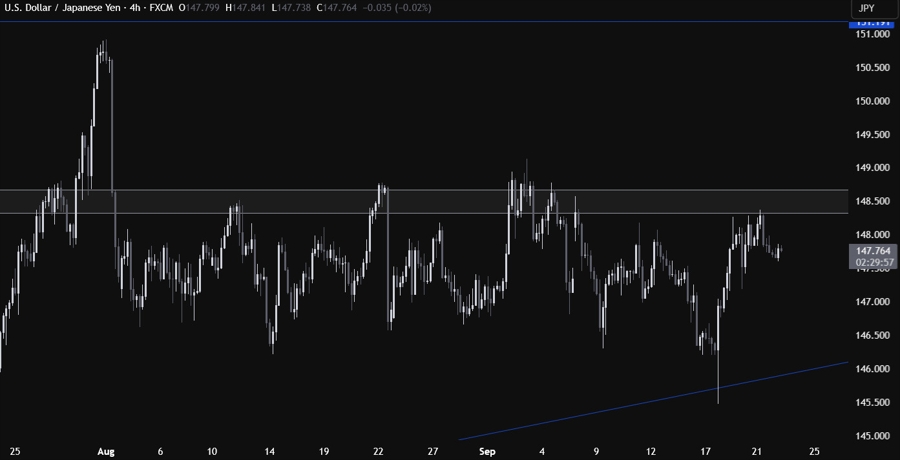
On the 4 hour chart, we can see more clearly the rangebound price action that’s been going on since August. We got the spike lower on the Fed’s decision but eventually the price bounced on the trendline and rallied all the way back to the resistance. There’s not much else we can glean from this timeframe, so we need to zoom in to see some more details.
USDJPY Technical Analysis – 1 hour Timeframe
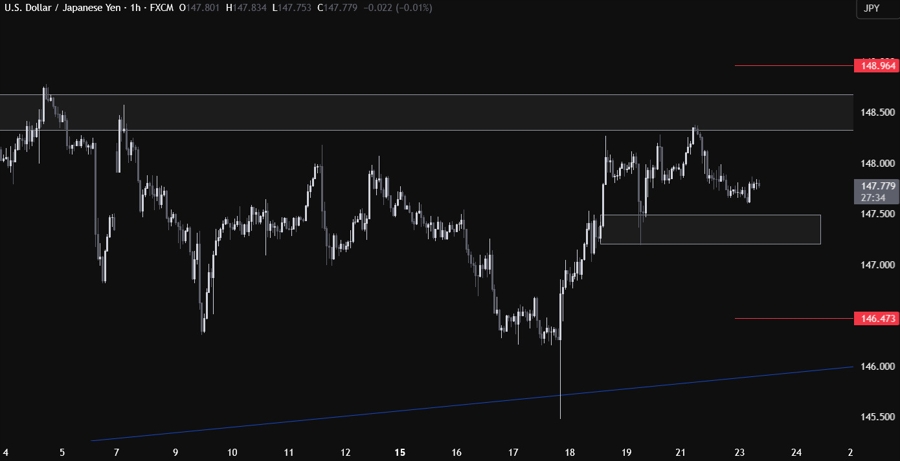
On the 1 hour chart, we can see that we have a minor support zone between the 147.20-147.50 levels. If the price falls into that zone, we can expect the buyers to step in with a defined risk below the support to position for a rally into the 151.00 handle. The sellers, on the other hand, will want to see the price breaking lower to pile in for a drop into the major trendline. The red lines define the average daily range for today.
Upcoming Catalysts
Today we have the US Flash PMIs, as well as Fed Chair Powell speaking. Tomorrow, we have the Japanese Flash PMIs. On Thursday, we get the latest US Jobless Claims figures. On Friday, we conclude the week with the Tokyo CPI and the US PCE report. Keep also an eye on Fed speakers this week.


