
FUNDAMENTAL OVERVIEW
USD:
The US dollar rallied across the board yesterday on safe haven demand as US-Iran conflict erupted over the weekend. The main driver though was the market’s realisation that rate cuts might not come as soon as expected.
In fact, higher oil prices will eventually put upward pressure on inflation and yesterday’s ISM Manufacturing PMI showed how wrong the market has been in being so dovish on the economy. The data was hot for the second consecutive month, so the one-off narrative was put to rest.
Moreover, the prices index jumped to the highest level since 2022, in another sign that inflationary pressures remain high. Traders pared back their rate cut bets with the total easing by year-end now seen around 49 bps vs 58 bps on Friday.
JPY:
On the JPY side, nothing has changed as PM Takaichi’s opposition and, more importantly the data, haven’t been supporting a rate hike any time soon. The latest Japanese CPI fell below the BoJ’s 2% target, dealing another blow to the central bank’s efforts to further raise interest rates.
The market is still pricing a rate hike in June at the earliest with a total of two rate hikes by year-end. This looks very optimistic right now. The Japanese yen will continue to weaken as rate hike expectations get pushed further out.
USDJPY TECHNICAL ANALYSIS – DAILY TIMEFRAME
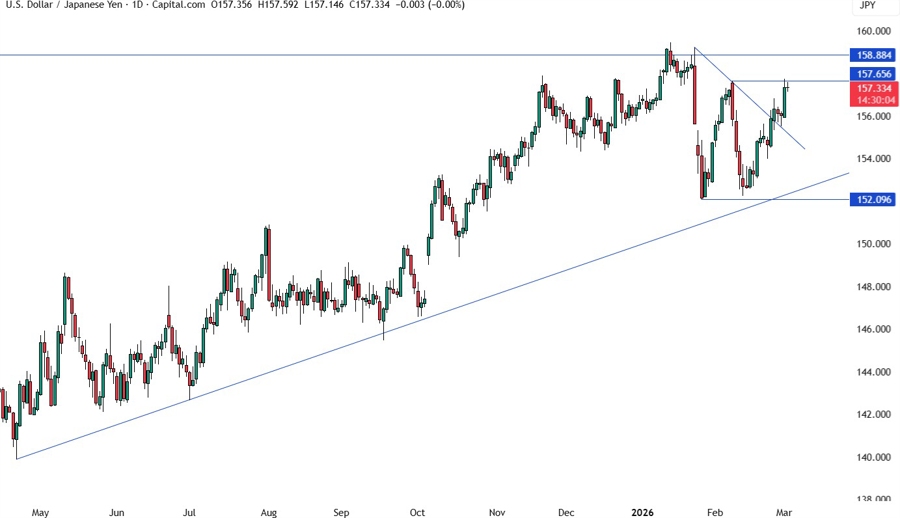
On the daily chart, we can see that USDJPY retested the broken trendline and eventually extended the gains into the key swing level at 157.65. This is where we can expect the sellers to step in with a defined risk above the swing level to position for a drop back into the major upward trendline. The buyers, on the other hand, will look for a break higher to increase the bullish bets into the 159.00 handle next.
USDJPY TECHNICAL ANALYSIS – 4 HOUR TIMEFRAME
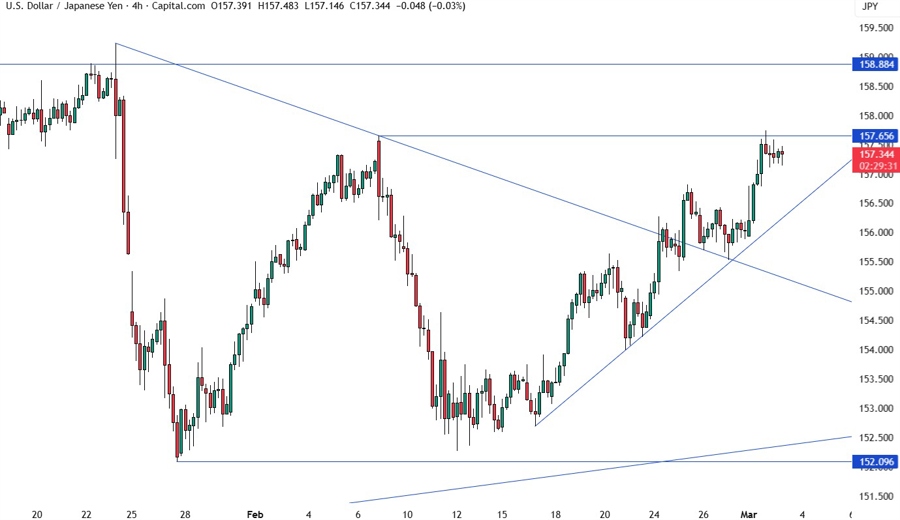
On the 4 hour chart, we can see that we have an upward trendline defining the bullish momentum. If we get a pullback, we can expect the buyers to lean on the trendline with a defined risk below it to keep pushing into new highs. The sellers, on the other hand, will look for a break lower to increase the bearish bets into the 153.00 handle next.
USDJPY TECHNICAL ANALYSIS – 1 HOUR TIMEFRAME
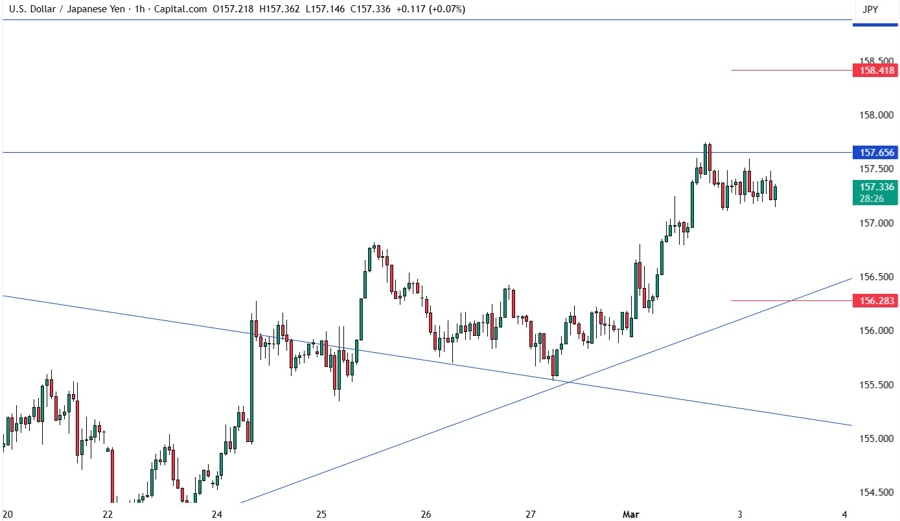
On the 1 hour chart, there’s not much we can add here as the buyers will likely pile in on the break of the 157.65 resistance or around the trendline, while the sellers will keep on stepping in around these levels to target a pullback into the trendline. The red lines define the average daily range for today.
UPCOMING CATALYSTS
Tomorrow we have the US ADP and the US ISM Services PMI. On Thursday, we get the latest US Jobless Claims figures. On Friday, we conclude the week with the US NFP report. The data might not matter much this week amid the US-Iran conflict.
