
FUNDAMENTAL OVERVIEW
USD:
The US dollar sold off across the board on Wednesday after Trump announced on Truth Social a two-sided ceasefire agreement for two weeks while the US and Iran negotiate a lasting peace deal. Since then, the price action became more rangebound due to Israeli attacks against Lebanon which the Iranians have been saying was part of the ceasefire agreement.
The good news is that Iran held off from retaliating ahead of the peace talks in Islamabad this weekend. But the uncertainty has been keeping the markets in check, nonetheless. Everything hinges on these peace talks as the restart of the war would create strong distress in the markets and potentially lead to a global recession.
In the short-term, a peace deal would weigh on the greenback amid renewed rate cut bets and unwinding of the March positioning. On the other hand, a breakdown of negotiations would give the dollar another boost, potentially pushing it into new highs.
JPY:
On the JPY side, the currency strengthened recently just because of dollar weakness and as things settled a bit, the yen restarted its downward trend as the Japanese macro conditions remain negative. In fact, despite the growing expectations of a rate hike at the upcoming meeting, inflation in Japan has been gradually easing with most metrics being near or below the 2% target.
Moreover, the US-Iran war hasn’t only put upward pressure on inflation but also downward pressure on growth. The end of the war would certainly be good news for the economy and should lift business sentiment which might eventually translate in favourable conditions for a rate hike. Right now, the market is pricing in a 51% chance of a BoJ hike in April.
The central bank is more likely to hold interest rates steady though and let things settle after the conclusion of the war. What the BoJ could do at the April meeting is to lay the groundwork for a rate hike in June if they think they have the right conditions in place.
USDJPY TECHNICAL ANALYSIS – DAILY TIMEFRAME
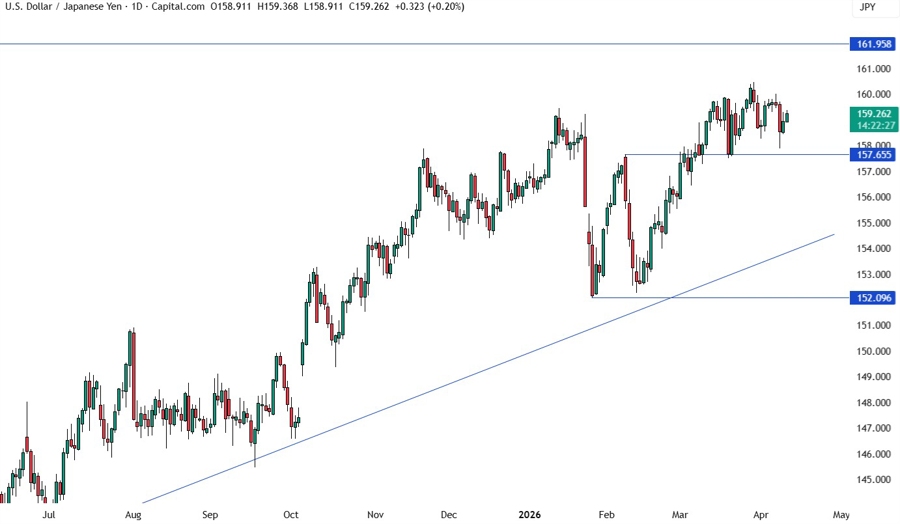
On the daily chart, we can see that USDJPY couldn’t reach the 157.65 support and bounced around the 158.00 handle. There’s not much we can glean from this timeframe, so we need to zoom in to see some more details.
USDJPY TECHNICAL ANALYSIS – 4 HOUR TIMEFRAME
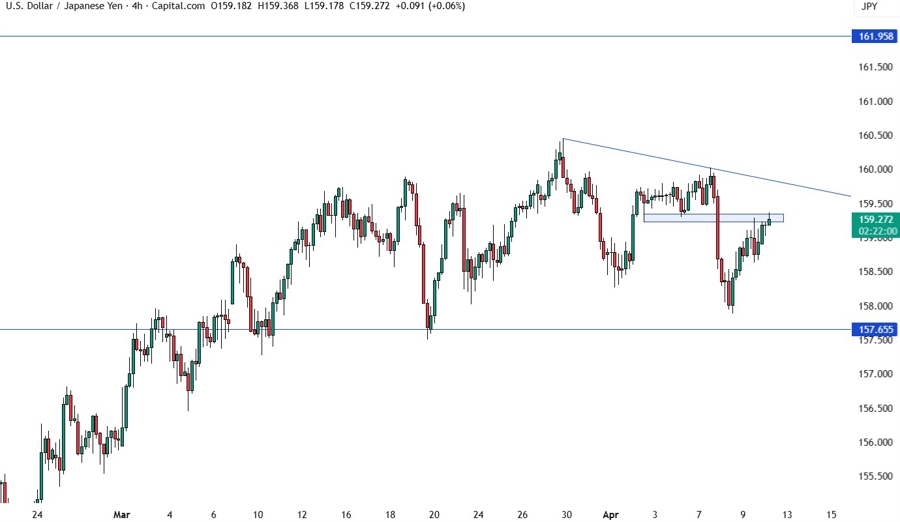
On the 4 hour chart, we can see the price is struggling around the 159.30 resistance zone. The sellers are stepping in here with a defined risk above the resistance to position for a drop into the 157.65 support. The buyers, on the other hand, will want to see the price breaking higher to extend the rally into the downward trendline around the 159.80 level.
USDJPY TECHNICAL ANALYSIS – 1 HOUR TIMEFRAME
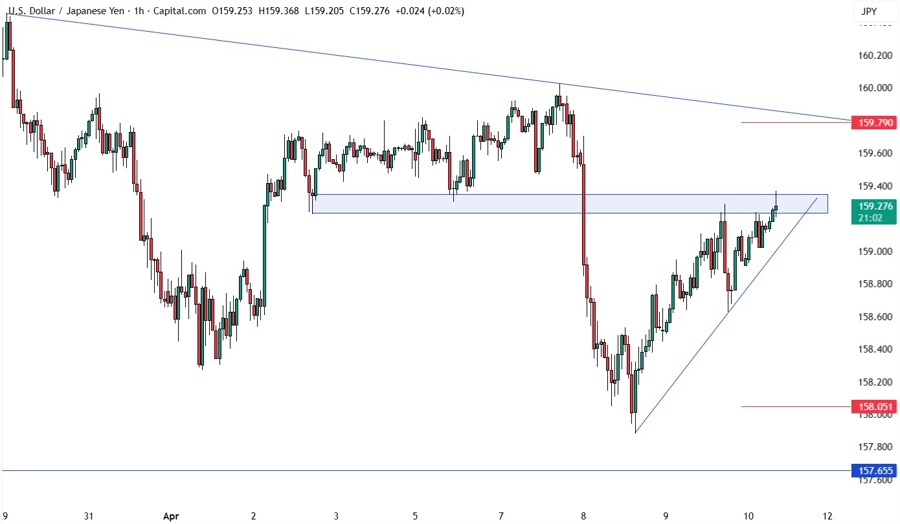
On the 1 hour chart, we have an upward trendline defining the bullish momentum on this timeframe. The buyers will likely continue to lean on the trendline to keep pushing into new highs, while the sellers will look for a break to increase the bearish bets into the 157.65 support next. The red lines define the average daily range for today.
UPCOMING CATALYSTS
Today we conclude the week with the US CPI report and the University of Michigan Consumer Sentiment survey.


