
There are a couple of interesting things with regards to the BOJ decision today. The first that stands out is of course the vote on interest rates. Takata and Tamura dissented in favour of opting for a 25 bps rate hike, and that led to the 7-2 majority in keeping rates on hold. That's a standout that is helping to push the yen higher, with it having a more hawkish twist.
However, the other thing to note as well is that the BOJ is now set to unload its ETF holdings. That being said, do keep in mind that there's a bit of a caveat to how the central bank is set to sell its ETF holdings. For some context, the BOJ holds about ¥37 trillion in ETFs. And the decision today notes that they are to sell around ¥330 billion of ETFs annually. Yes, you read that right.
In simpler terms, it would take the BOJ roughly 112 years to unwind all of its ETF holdings going by the current pace. So, that puts into context how miniscule and minimal their "selling" really is. They did say that they will adjust the pace of sales in the future but I don't think they will plan to shake up the market all too much. *coughs* Sorry, the BOJ is already the market.
Nonetheless, it's still enough to provoke a reaction in domestic assets. Japanese stocks are selling off and that's also feeding in part to further yen strength, besides the monetary policy discourse above.
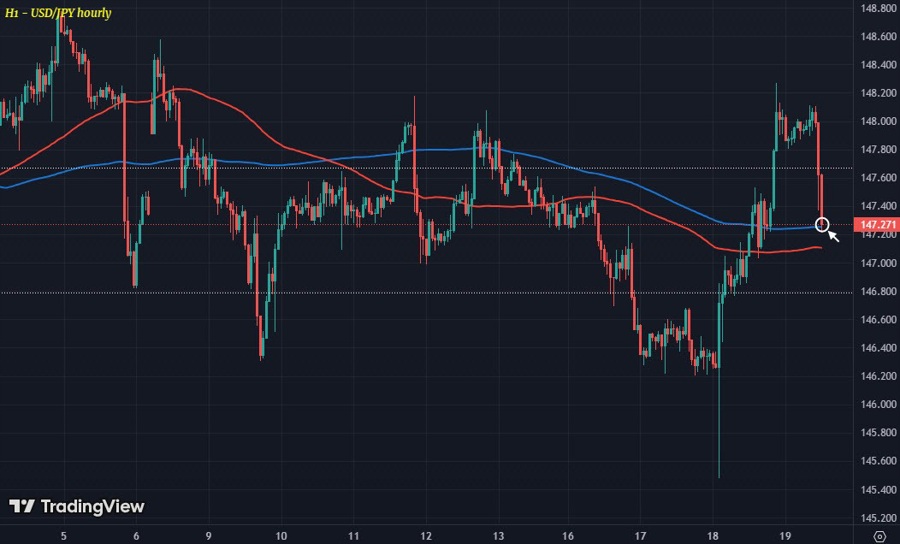
USD/JPY has dipped back to around 147.27 and is now contesting its 200-hour moving average (blue line) of 147.25. For buyers, keeping above that will still see them hold near-term control after a solid rebound following the FOMC meeting this week.
In the bigger picture though, USD/JPY still isn't really going anywhere over the past few weeks.
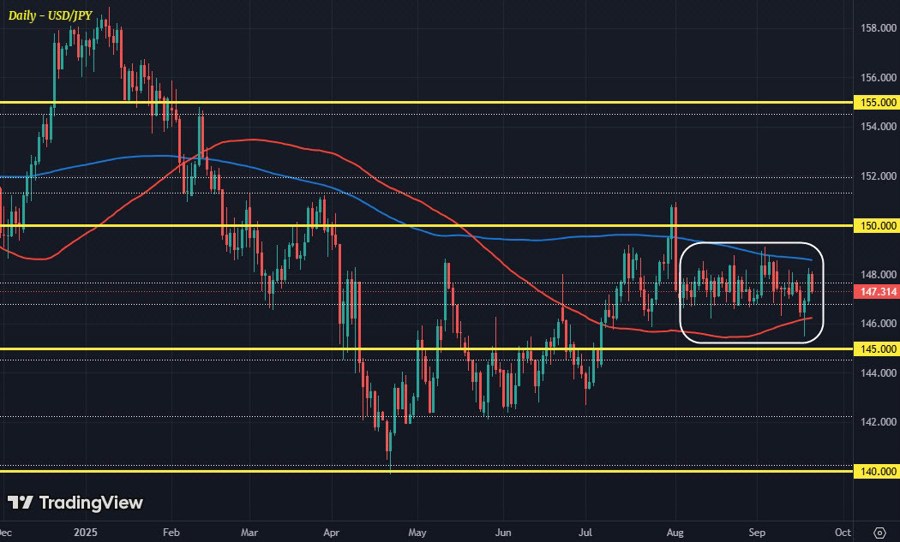
The pair is still caught rangebound in between its 100 (red line) and 200-day (blue line) moving averages and there needs to be a firm break on either side for the next trending leg to be apparent.


