
FUNDAMENTAL OVERVIEW
USD:
The US Dollar continues to rebound against the major currencies after the strong selloff experienced in the last couple of weeks of January. The greenback remains supported by improving US data and strong PMIs potentially hinting to stronger economic activity going forward.
If the data continues to come out strong, traders will have to pare back their dovish Fed bets, and that’s going to boost the US Dollar further. The US NFP and CPI reports next week will be critical.
The trend for the dollar is looking increasingly bullish, but traders will still look for confirmation from the data to gain more conviction. We can expect a rally in the greenback across the board on a strong NFP report ands more so if the CPI data surprises to the upside. Soft data, on the other hand, will likely put some pressure on the dollar, although we shouldn’t see the same momentum experienced in January.
INR:
The Indian Rupee remains on a bearish structural trend against the US Dollar, but the latest positive development on the tariffs front gave the INR a strong boost. In fact, US President Trump announced on Truth Social that they reached a deal with India and the US will lower the tariffs from 25% to 18%.
Tomorrow, we have the RBI rate decision where the central bank is expected to hold interest rates steady after inflation increased to 1.33% in December vs 0.71% in November. Analysts expect further improvement towards the RBI’s target in the next months.
USDINR TECHNICAL ANALYSIS – DAILY TIMEFRAME
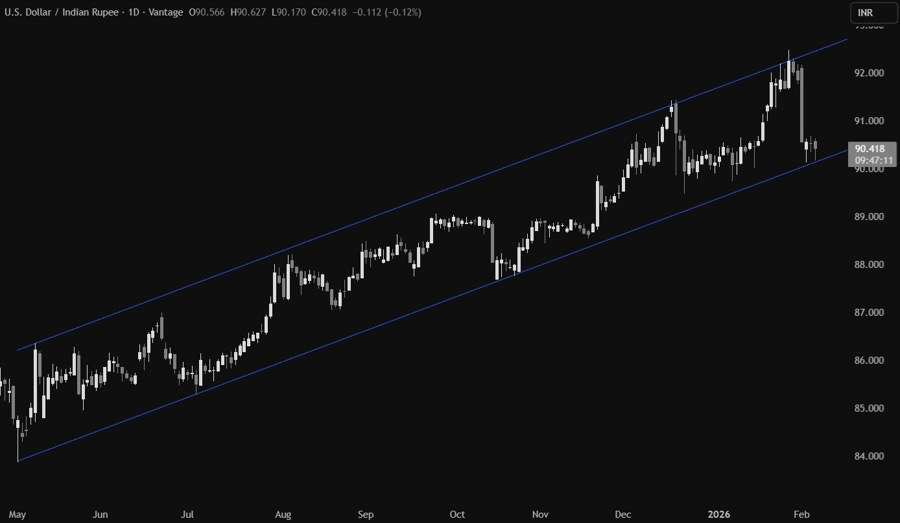
On the daily chart, we can see that USDINR is rejecting the lower bound of the channel. This is where the buyers are stepping in with a defined risk below the bottom trendline to position for a rally back into the upper bound of the channel. The sellers will want to see the price breaking lower to pile in for a drop into new lows.
USDINR TECHNICAL ANALYSIS – 4 HOUR TIMEFRAME
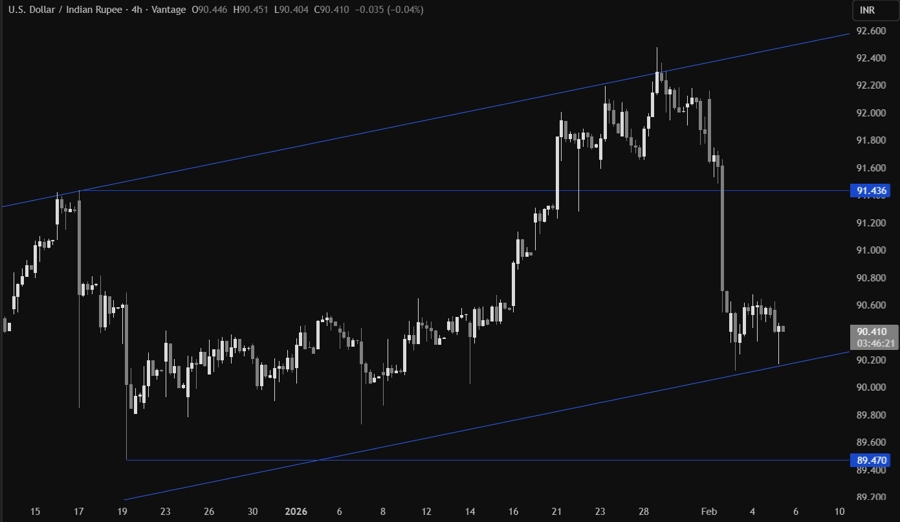
On the 4 hour chart, we can see more clearly the consolidation at the lower bound of the channel. There’s not much we can add here as the buyers will continue to step in to keep targeting the top trendline, while the sellers will look for a break lower to increase the bearish bets into the 89.50 level next.
USDINR TECHNICAL ANALYSIS – 1 HOUR TIMEFRAME
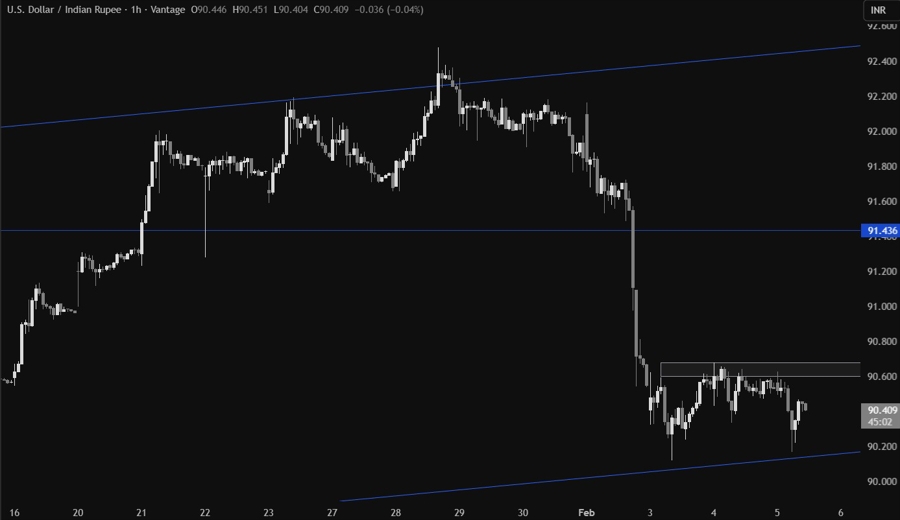
On the 1 hour chart, we can see that we have a minor resistance zone around the 90.60 level. If the price gets there, we can expect the sellers to step in at the resistance with a defined risk above it to keep pushing into new lows. The buyers, on the other hand, will look for a break higher to increase the bullish bets into new highs.
UPCOMING CATALYSTS
Today we have the US Jobless Claims and Job Openings data. Tomorrow, we conclude the week with the RBI rate decision and the University of Michigan Consumer Sentiment report.


