
Fundamental Overview
The USD has weakened pretty much across the board last week despite a strong US ADP and ISM Services PMI. As mentioned previously, when markets react like that it’s generally a signal of a short-term top with the market needing more to keep the trend going.
In fact, the market pricing is now showing a 63% probability of a December cut, which is about right. The NFP and CPI reports will have the final say, and hopefully we will get them before the next FOMC decision.
On the CHF side, nothing has changed. The SNB left interest rates steady and kept everything unchanged at the last meeting. SNB’s members continue to repeat that the bar for negative rates is high, and Chairman Shlegel recently said that he expects inflation to rise slightly in the next quarters. We got a soft Swiss CPI report last week which weighed a bit on the CHF, but it didn’t change anything for the SNB.
USDCHF Technical Analysis – Daily Timeframe
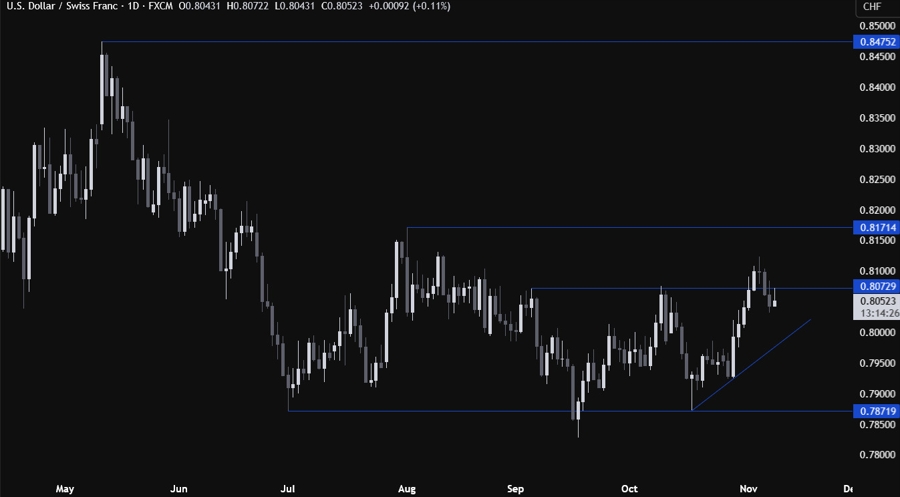
On the daily chart, we can see that USDCHF fell back below the key 0.8073 level. The sellers piled in with a defined risk above the 0.8073 level to extend the pullback into the upward trendline. If we get there, we can expect the buyers to lean on the trendline with a defined risk below it to position for a rally into the 0.8171 level next.
USDCHF Technical Analysis – 4 hour Timeframe
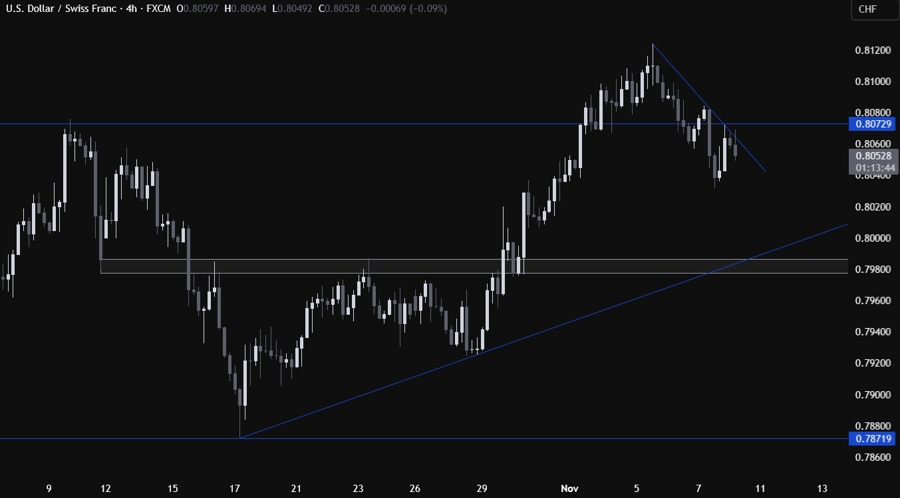
On the 4 hour chart, we can see that we have a downward trendline defining the current pullback. The sellers will likely continue to lean on the trendline to keep pushing into new lows, while the buyers will look for a break higher to pile in for a rally into the 0.8171 level next.
USDCHF Technical Analysis – 1 hour Timeframe
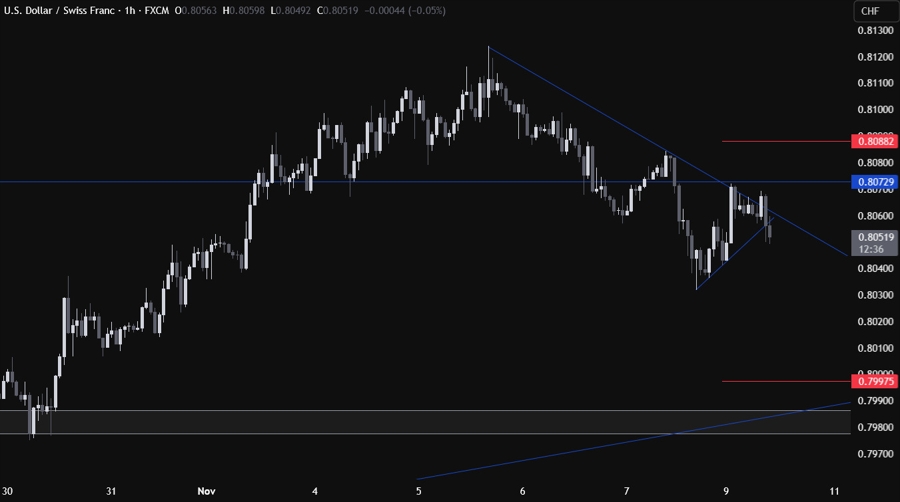
On the 1 hour chart, we can see that the price broke below the minor counter-trendline this morning. The sellers might have more conviction to keep pushing into new lows here, while the buyers will want to see the price breaking higher to start targeting the 0.8171 level. The red lines define the average daily range for today.
Upcoming Catalysts
This week is pretty empty on the data front. We just have the weekly US ADP data tomorrow.


