Fundamental Overview
The USD sold off across the board on Friday as Fed Chair Powell tilted more dovish by saying that “with policy in restrictive territory, the baseline outlook and the shifting balance of risks may warrant adjusting our policy stance.”
That saw traders firming up expectations for a rate cut in September which now stands around 82% probability with a total of 54 bps of easing by year-end. Overall, it’s not the repricing in interest rates expectations that weighed on the greenback but hedges being unwound.
Now, the focus turns to the US NFP report next week which is going to be crucial and will influence greatly interest rates expectations. Strong data might take the probability for a September cut towards a 50/50 chance but will certainly see a more hawkish repricing further down the curve. Soft data, on the other hand, will likely see traders increasing the dovish bets with a third cut by year-end being priced in.
On the CHF side, we haven’t got anything new in terms of monetary policy as the SNB is now in a long pause. The latest Swiss CPI showed a slight improvement in inflation although it wasn't important as the central bank will not hike rates for a long time. The market doesn’t expect the SNB to cut anymore.
There’s some focus at the moment on the 39% tariffs that the US slapped on Switzerland. That is likely to be resolved in the near future with the rate being set between 10-20% as we’ve seen for most other countries.
USDCHF Technical Analysis – 4 hour Timeframe

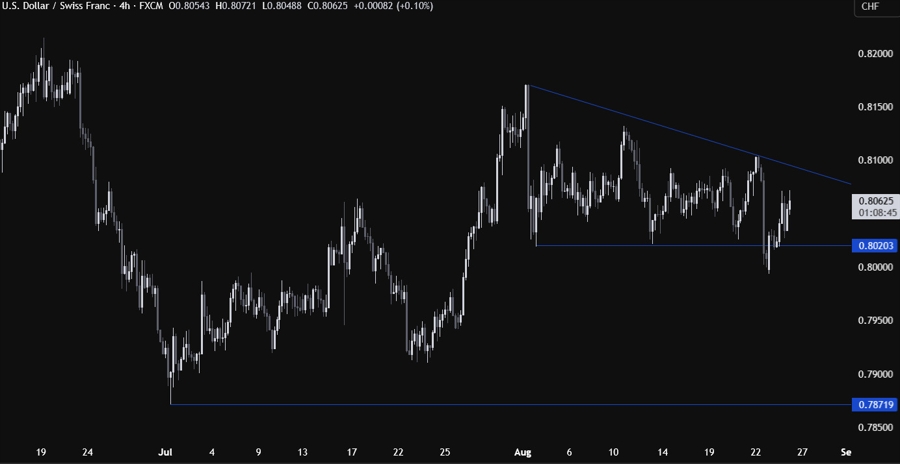
On the 4 hour chart, we can see that the price broke below the 0.8020 support following Powell’s dovish tilt but eventually the market erased most of the losses as the focus turned to the US data, which is going to be the ultimate judge.
If the price rallies all the way back to the trendline, we can expect the sellers to lean on it with a defined risk above it to position for a drop back into the support. The buyers, on the other hand, will look for a break higher to increase the bullish bets into the 0.82 handle next.
USDCHF Technical Analysis – 1 hour Timeframe

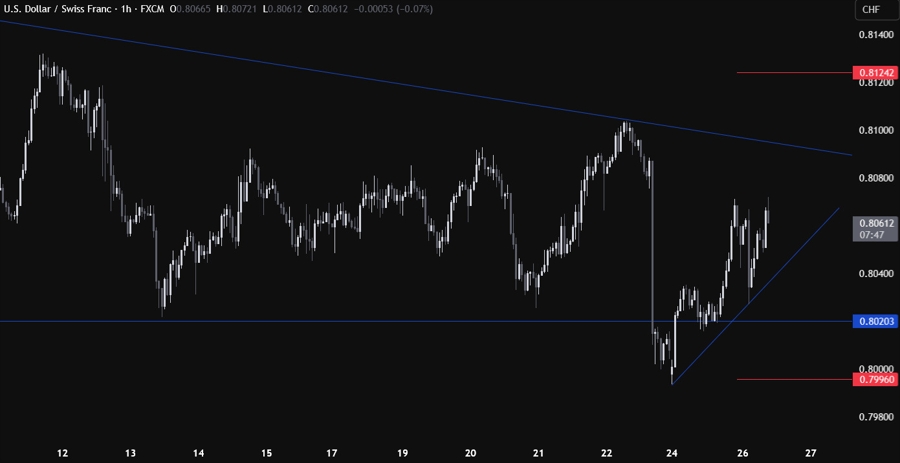
On the 1 hour chart, we can see that we have a minor upward trendline defining the bullish momentum on this timeframe. If we were to get a pullback, the buyers will likely lean on the trendline with a defined risk below it to keep pushing into the major trendline. The sellers, on the other hand, will look for a break lower to pile in for a drop into new lows. The red lines define the average daily range for today.
Upcoming Catalysts
Todaywe have the US Consumer Confidence report. On Thursday, we get the latest US Jobless Claims figures. On Friday, we conclude the week with the US PCE price index.


