
FUNDAMENTAL OVERVIEW
USD:
The US Dollar came under some more pressure yesterday following soft US Retail Sales and US ECI data. We got a slightly dovish repricing on the back of the weaker data with the market now pricing 60 bps of easing by year-end compared to 58 bps before the data release.
The focus today is solely on the US NFP report as it could be pivotal for the US Dollar. Given the current market pricing there’s a high risk of a hawkish repricing in case the data comes out strong. In such a scenario, we will likely see the greenback rallying across the board.
On the other hand, a weak report should strengthen the case for more Fed easing and might even see traders bringing forward rate cut bets as some Fed members expressed scepticism about labour market stabilisation. In that case, the US Dollar will likely come under renewed pressure on dovish Fed bets.
CHF:
On the CHF side, nothing has changed. The SNB left everything unchanged at the last meeting and sounded a bit more positive on the future outlook given the lower US tariff rate. SNB’s members continue to repeat that the bar for negative rates remains high, so that leaves the Swiss Franc trading mostly based on risk sentiment.
USDCHF TECHNICAL ANALYSIS – DAILY TIMEFRAME
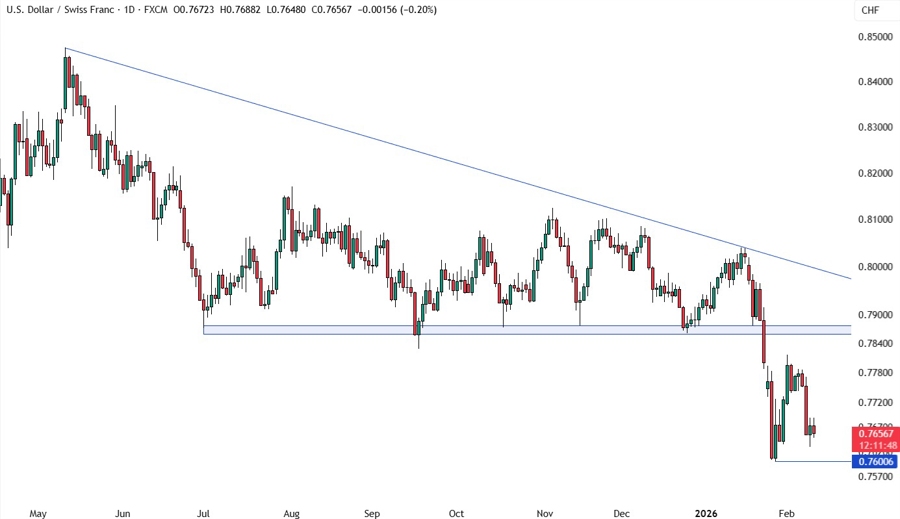
On the daily chart, we can see that USDCHF dropped back near the January levels. If the price reaches the January low, we can expect the buyers to step in with a defined risk below the low to position for a rally into the 0.7870 resistance. The sellers, on the other hand, will look for a break lower to increase the bearish bets into new cycle lows.
USDCHF TECHNICAL ANALYSIS – 4 HOUR TIMEFRAME
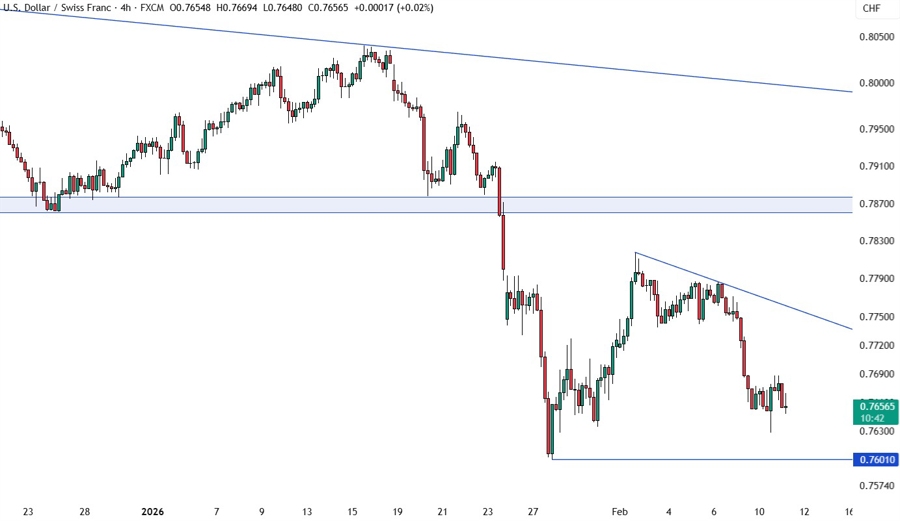
On the 4 hour chart, we can see a downward trendline defining the bearish momentum. From a risk management perspective, the sellers will have a better risk to reward setup around the trendline to position for a drop into new lows. The buyers, on the other hand, will look for a break higher to extend the rally into the 0.7870 resistance.
USDCHF TECHNICAL ANALYSIS – 1 HOUR TIMEFRAME
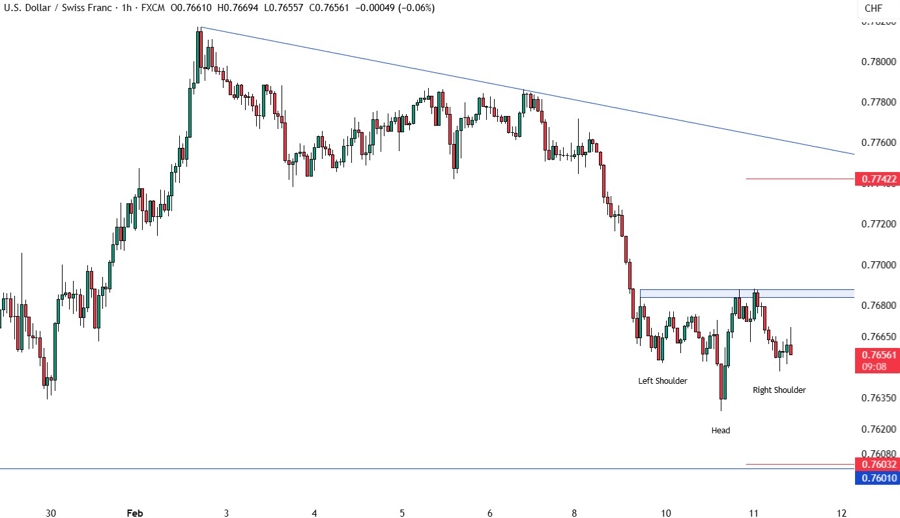
On the 1 hour chart, we can see that we have a minor resistance zone around the 0.7687 level. The recent price action might have formed an inverted head and shoulder pattern with the resistance as the neckline. If the price gets there, we can expect the sellers to step in again at the resistance with a defined risk above it to keep pushing into new lows. The buyers, on the other hand, will look for a break higher to pile in for a rally into the trendline next. The red lines define the average daily range for today.
UPCOMING CATALYSTS
Today we have the US NFP report. Tomorrow, we get the US Jobless Claims figures. On Friday, we conclude the week with the Swiss CPI and the US CPI data.


