
FUNDAMENTAL OVERVIEW
USD:
The US Dollar sold off across the board on Friday following rumours of the NY Fed conducting rate checks on the USD/JPY pair. The market took that as a signal of a potential intervention to strengthen the Japanese Yen and the unwinding of positions weighed on the greenback.
This wasn’t a fundamental-driven move but a “technical” one. In general, such reactions are eventually faded in the following days. The problem for the dollar is that there’s no strong reason for it to appreciate yet.
This week, we have the FOMC decision on Wednesday where the central bank is expected to keep interest rates unchanged and maintain a data-dependent approach for the next rate cuts. There shouldn’t be any surprise at this meeting. February might be key for the US Dollar as we get another set of economic data, with the NFP report likely being pivotal for the market pricing.
In fact, we’ve been seeing notable improvements in the US Jobless Claims data that could point to a re-acceleration in the labour market. The market is still pricing 48 bps of easing by year-end. Those bets are likely to be pared back in case the data strengthens and should provide support for the greenback.
CHF:
On the CHF side, nothing has changed. The SNB left everything unchanged at the last meeting and sounded a bit more positive on the future outlook given the lower US tariff rate. SNB’s members continue to repeat that the bar for negative rates remains high, so that leaves the Swiss Franc trading mostly based on risk sentiment.
USDCHF TECHNICAL ANALYSIS – DAILY TIMEFRAME
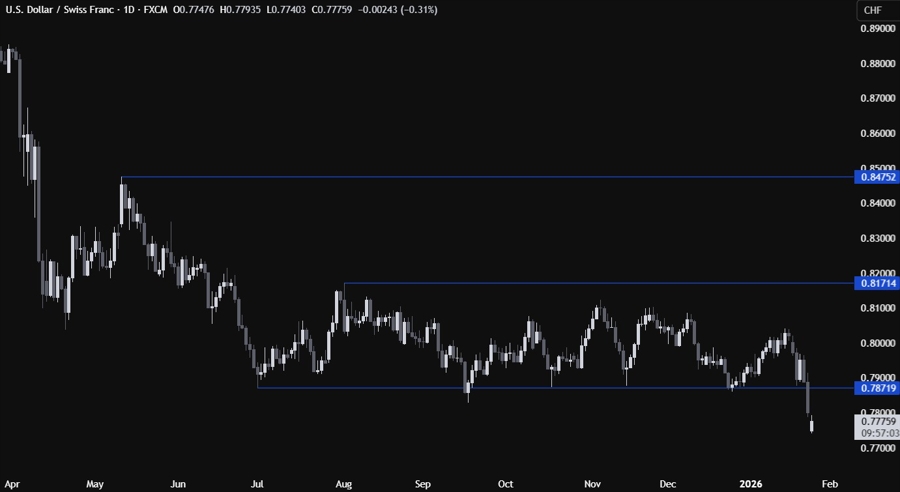
On the daily chart, we can see that USDCHF broke below the key 0.7871 level and extended the drop into new cycle lows. There’s not much we can glean from this timeframe, so we need to zoom in to see some more details.
USDCHF TECHNICAL ANALYSIS – 4 HOUR TIMEFRAME
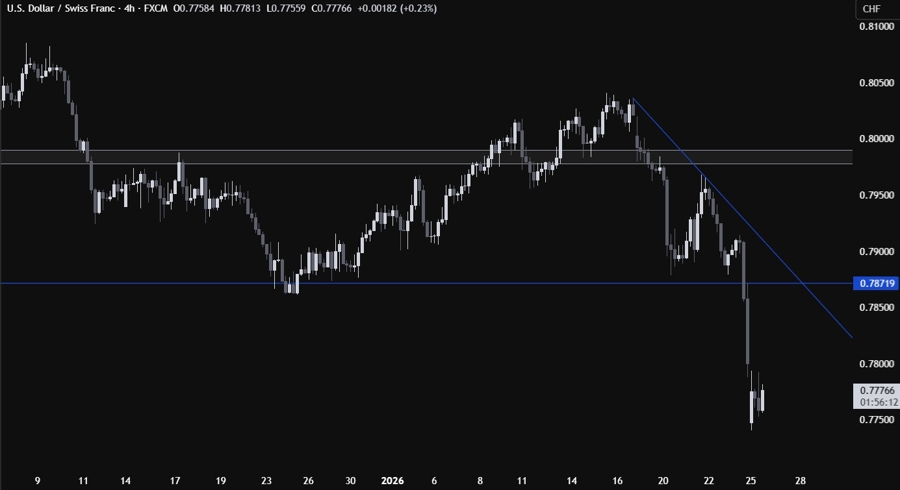
On the 4 hour chart, we can see that we have a downward trendline defining the bearish momentum on this timeframe. From a risk management perspective, the sellers will have a better risk to reward setup around the trendline to position for a drop into new lows. The buyers, on the other hand, will look for a break higher to pile in for a rally into the 0.80 handle next.
USDCHF TECHNICAL ANALYSIS – 1 HOUR TIMEFRAME
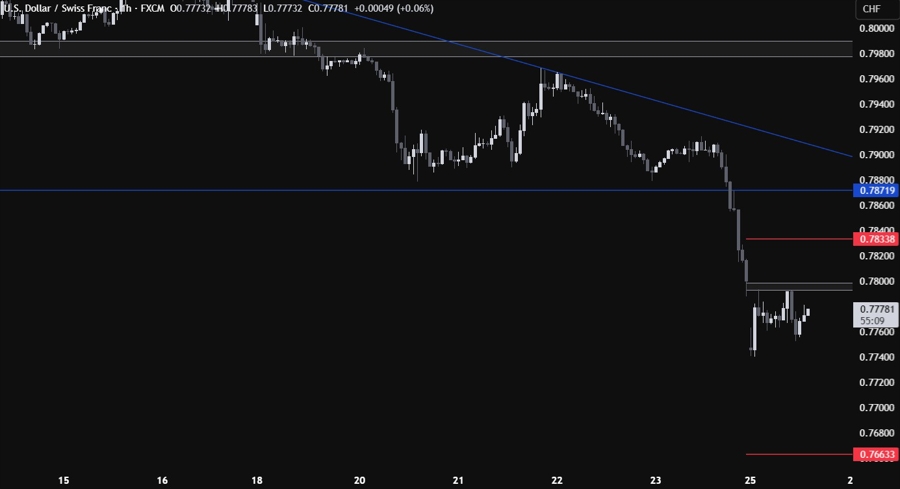
On the 1 hour chart, we can see that we have a minor resistance zone around the 0.78 handle. The sellers continue to lean on it with a defined risk above it to keep pushing into new lows. The buyers will look for a break higher to pile in for a pullback into the trendline. The red lines define the average daily range for today.
UPCOMING CATALYSTS
Tomorrow we have the weekly US ADP jobs data and the US Consumer Confidence report. On Wednesday, we have the FOMC policy announcement. On Thursday, we get the latest US Jobless Claims figures. On Friday, we conclude the week with the US PPI report.
